
You will definitely be able to run the code and the examples shown in this book directly from the standard R Graphical User Interface (GUI), especially if you are frequently working with R in more complex projects or simply if you like to keep an eye on the different components of your code, such as scripts, plots, and help pages, you may well think about the possibility of using an IDE. The number of specific IDEs that get integrated with R is still limited, but some of them are quite efficient, well-designed and open source.
RStudio (http://www.rstudio.com/) is a very nice and advanced programming environment developed specifically for R, and this would be my recommended choice of IDE as the R programming environment in most cases. It is available for all the major platforms (Windows, Linux, and Mac OS X), and it can be run on a local machine, such as your computer, or even over the Web, using RStudio Server. With RStudio Server, you can connect a browser-based interface (the RStudio IDE) to a version of R running on a remote Linux server.
RStudio allows you to integrate several useful functionalities, in particular if you use R for a more complex project. The way the software interface is organized allows you to keep an eye on the different activities you very often deal with in R, such as working on different scripts, overviewing the installed packages, as well as having easy access to the help pages and the plots generated. This last feature is particularly interesting for ggplot2 since in RStudio, you will be able to easily access the history of the plots created instead of visualizing only the last created plot, as is the case in the default R GUI. One other very useful feature of RStudio is code completion. You can, in fact, start typing a comment, and upon pressing the Tab key, the interface will provide you with functions matching what you have written . This feature will turn out to be very useful in ggplot2, so you will not necessarily need to remember all the functions and you will also have guidance for the arguments of the functions as well.
In Figure 1.1, you can see a screenshot from the current version of RStudio (v 0.98.1091):
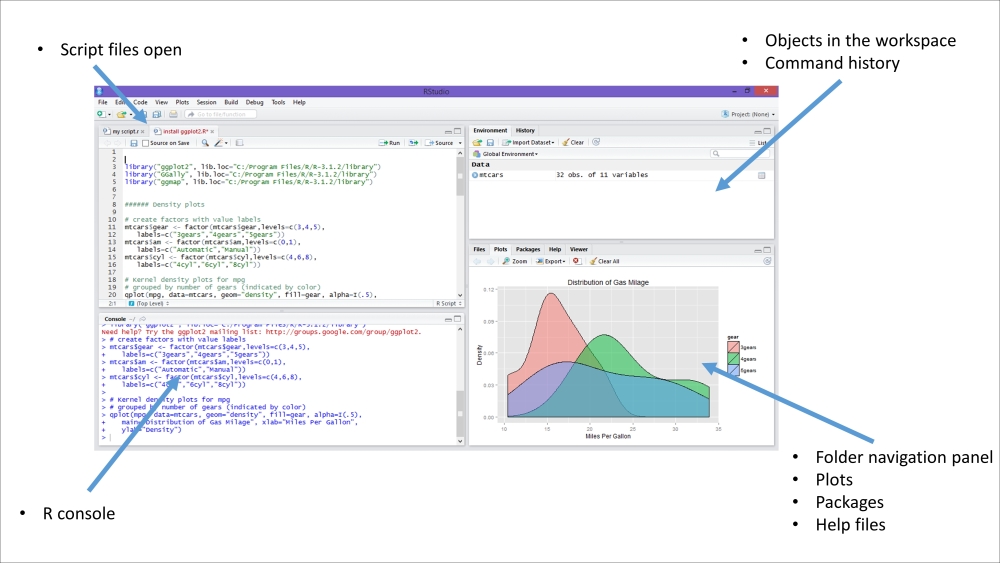
Figure 1.1: This is a screenshot of RStudio on Windows 8
The environment is composed of four different areas:
Scripting area: In this area you can open, create, and write the scripts.
Console area: This area is the actual R console in which the commands are executed. It is possible to type commands directly here in the console or write them in a script and then run them on the console (I would recommend the last option).
Workspace/History area: In this area, you can find a practical summary of all the objects created in the workspace in which you are working and the history of the typed commands.
Visualization area: Here, you can easily load packages, open R help files, and, even more importantly, visualize plots.
The RStudio website provides a lot of material on how to use the program, such as manuals, tutorials, and videos, so if you are interested, refer to the website for more details.
Eclipse (http://www.eclipse.org/) is a very powerful IDE that was mainly developed in Java and initially intended for Java programming. Subsequently, several extension packages were also developed to optimize the programming environment for other programming languages, such as C++ and Python. Thanks to its original objective of being a tool for advanced programming, this IDE is particularly intended to deal with very complex programming projects, for instance, if you are working on a big project folder with many different scripts. In these circumstances, Eclipse could help you to keep your programming scripts in order and have easy access to them. One drawback of such a development environment is probably its big size (around 200 MB) and a slightly slow-starting environment.
Eclipse does not support interaction with R natively, so in order to be able to write your code and execute it directly in the R console, you need to add StatET to your basic Eclipse installation. StatET (http://www.walware.de/goto/statet) is a plugin for the Eclipse IDE, and it offers a set of tools for R coding and package building. More detailed information on how to install Eclipse and StatET and how to configure the connections between R and Eclipse/StatET can be found on the websites of the related projects.
Emacs (http://www.gnu.org/software/emacs/) is a customizable text editor and is very popular, particularly in the Linux environment. Although this text editor appears with a very simple GUI, it is an extremely powerful environment, particularly thanks to the numerous keyboard shortcuts that allow interaction with the environment in a very efficient manner after getting some practice. Also, if the user interface of a typical IDE, such as RStudio, is more sophisticated and advanced, Emacs may be useful if you need to work with R on systems with a poor graphical interface, such as servers and terminal windows. Like Eclipse, Emacs does not support interfacing with R by default, so you will need to install an add-on package on your Emacs that will enable such a connection, Emacs Speaks Statistics (ESS). ESS (http://ess.r-project.org/) is designed to support the editing of scripts and interacting with various statistical analysis programs including R. The objective of the ESS project is to provide efficient text editor support to statistical software, which in some cases comes with a more or less defined GUI, but for which the real power of the language is only accessible through the original scripting language.