
Now it is time to see how to create a layout for a report. In Dynamics NAV, we have a choice of either Visual Studio or Report Builder. Let's start by comparing the two.
In the Dynamics NAV development environment you can set the Use Report Builder option, via Tools/Options. If set to No, then the system will use Visual Studio to create the report layout, otherwise Report Builder will be used.
Note
By default, the option is set to No, even when Visual Studio is not installed. You have to manually set this to yes if you want to use Report Builder.
Report Builder is (normally) installed together with Dynamics NAV when you install the development environment. Visual Studio has to be installed separately. Report Builder is free and can be downloaded from the Microsoft website. To be able to create report layouts with Visual Studio in Dynamics NAV 2013, you need at least the Professional edition of Visual Studio, which is not free.
Note
More information about which version of Visual Studio is right for your environment is available here:
https://msdn.microsoft.com/en-us/library/dd301054(v=nav.80).aspx#DevEnv
As from Dynamics NAV 2015 you can use the Visual Studio Community Edition 2013, which is free and can be downloaded from https://www.visualstudio.com/en-us/news/vs2013-community-vs.aspx.
In this section, we are going to use Report Builder to create a report layout. Make sure you set the option Use Report Builder to Yes.
I will start with the report Packt - CH01-1, which contains a data item for the integer table, and I will create a simple layout to display an item list.
From the report dataset designer, click on View, Layout to open Report Builder:

On the left-hand side you can see the Report Data section in Report Builder. It contains:
Built-in Fields: The built in fields can be considered as constants or variables. They are not a part of the dataset and can be used in the layout, in textboxes or in expressions.
Parameters: Parameters contain the labels and captions that were added via the
IncludeCaptionproperty on a column, or via the label designer.Images: Images can be imported into the report layout as embedded images.
Data Sources: In Dynamics NAV RDLC reports, there is always exactly one data source. At runtime it links to the report dataset, generated by the report dataset designer.
Datasets: In Dynamics NAV RDLC reports, there is always exactly one dataset. It has the name
Dataset_Resultand contains the columns that were added in the report dataset designer.
At the top you can see the ribbon. It contains three sections:
Home: Here you can see formatting toolbars and buttons. You can use them to format the layout of textboxes in your report.
Insert: Here you can see the toolbox. It contains report items, which are divided into Data Regions, Data Visualizations, Report Items, Sub Reports and Header/Footer.
View: Here you can customize the Report Builder look and view. You can disable or enable Report Data, Grouping, Properties and Ruler.
At the bottom, you can see the Grouping pane. It contains Row and Column groups. You can use them when you want to add grouping to your report layout.
On the right you can see the Properties. Depending on what you select in the layout, you can see and edit its properties.
Report Builder contains wizards to help you to create a report layout. Let's use them to create our item list.
In the Insert tab in the ribbon, click on Insert, then Table, and then Table Wizard.
In the Choose a Dataset window select Dataset_Result and click on Next.
In the Arrange fields window you can now see the columns on the left. You can drag them to the right and put them into Values, Column Groups and/or Row groups. Let's drag the fields into Values:

For the inventory, click on the little arrow and select Sum. Click on Next.
In the Choose the Layout window, you can select grouping and totaling options, but only if you added a row and/or column group in the previous window. Click on Next.
In the Choose a Style window, you can select a style template. Click on Finish.
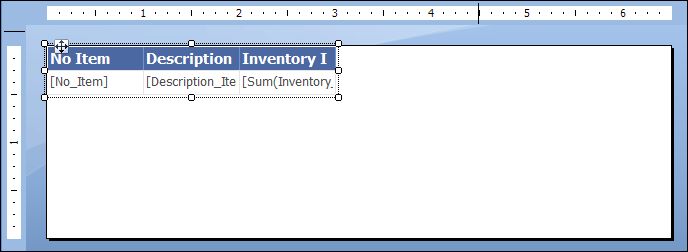
The wizard has ended and it has added a table to the body of the report:
Now, we are going to save and test the layout.
In Report Builder, click on the Save button (or Ctrl + S). Then close report builder. If you forget to save it, Report Builder displays the following message:

As you can deduce from this message, Dynamics NAV has generated a report.rdlc file and opened it in Report Builder. Then, we made changes to it, via the wizard. Now, it's asking us to save our modifications. This report.rdlc file will then be imported back into the report dataset designer. This happens when you click on a line in the report dataset designer:

Click on Yes (if you click on No the changes are not imported and will be lost.) After you click on Yes, the system will parse the report.rdlc file for errors. Some errors will be detected at this stage. Now you need to save the layout in the report object in the Dynamics NAV database. Click on File, Save (or Ctrl + S). When you save it, with the compile option checked, the system will parse the complete report and some errors might be detected.
Now run the report via File, Run (or Ctrl + R). The request page opens. Click on Preview:

To further enhance the report layout, you can reopen it via View, Layout.
Note
You don't have to close Report Builder if you know in advance the layout is not ready and you only want to test or preview it. In that case, save the layout in Report Builder and minimize Report Builder, don't close it. Then, click on a data item to import the layout, confirm and save, and run the report. If you need to make more changes to the layout, simply return to Report Builder, make your changes and follow the same steps to import your changes back into the report dataset designer.
It's very easy to create a simple layout using the wizards in Report Builder. I use it a lot for prototyping. You can then further enhance the report layout in Visual Studio.
In this section we are going to use Visual Studio to create a report layout. Make sure you set the option Use Report Builder to No.
I will start with the Item List report I created with Report Builder, but first, I will remove that layout by setting the processingonly property to yes. The following message is displayed:

After confirming and deleting the current layout, don't forget to set the property back to No.
Next, click on View, Layout to open Visual Studio:

In Visual Studio you can see similar sections to those in Report Builder.
Note
The Report Data window needs to be opened manually by selecting View, Report Data (or Ctrl + Alt + D). You will need to do this every time you open Visual Studio.
If Report Data is not available in the View window, then click somewhere in the body of the report to make it available in the View menu. Visual Studio automatically populates the toolbars with options depending on what you have selected in the layout.
To create a table layout, I will use the Toolbox. To open the Toolbox click on View, Toolbox:

Here, I will drag the table onto the report body. Alternatively, right-click in the report body and select Insert, Table:

To populate the table I will use the captions on the first row, which is the header row, and I will use the value fields from the dataset. From the parameters, drag the parameter into the textbox on the header row. Then, in the corresponding textbox on the detail row, click on the drop-down box to select the value:

There are many other ways of doing this, but I find this the easiest. Otherwise sometimes Visual Studio might create extra columns.
Repeat this process for all the columns. Then select the first row via its handle and make it bold. Next, we need to save our layout in Visual Studio, minimize it, and then go back into the report dataset designer and import it into the report object, just like we did with Report Builder. Then you can save and run the report to see the result.
Visual Studio contains many features to make report editing a pleasant experience. I will introduce these features in this and the following chapters.
In Visual Studio, you can change the layout of the report designer. You can move around the report data, properties and other sections. You can enable and disable toolbars, and so on. It's much more flexible than the report builder.
There is also the Format menu:

This menu contains many formatting options. They are especially useful when you need to align textboxes, for example in a document report.
There's also the Solution Explorer:

It contains the complete solution. Be careful, because only the report.rdlc file is imported into the report object. Any changes to the other items in the Solution Explorer are not saved. One advantage is that we can add extra template reports in the Solution Explorer. These templates can contain tables, lists, and matrices which you can pre-format and then copy and paste into your report layout. I will explain later how you can create and include these templates.
I would like to point out that there is a big difference between what you see and experience when you print an enhanced report onscreen and what you see and expect, when you actually print it on paper, or export it to Excel, Word or PDF.
When you run a report in the report viewer then it is fully functional. What I mean by this is that all interactive features the report contains are available to the end user. An enhanced report can, for example, contain hyperlink actions, expand/collapse functionality, drilldowns, and so on. When the user prints the report on paper, that interactivity is lost. If the main usage of a report is to print it, as document reports usually are, then don't spend much time adding interactivity to the report, because it will almost never be used and so will not be a very good return on investment.
Note
Don't enhance too much
From personal experience, I have seen many customers migrate towards enhanced reports as they are eager to implement a lot of interactive features in reports, and because it looks like a good thing to do. It is possible, so why not implement it?
Remember that adding functionality to reports should be based upon business requirements and not only because it looks nice. The more functionality you implement in reports, the more difficult it will be to maintain these reports.
Apart from the functional reasons online reports are better than printed reports, there's also the financial aspect. By using online reports, you will spend less on paper, ink, storage, binding, and distribution.
The ability of RDLC to export a report to PDF and/or Excel can help, but you must also remember that not all of the interactive features will still work in PDF and/or Excel. For example, drill down is available in Excel, but not in the PDF format.
Some reports look very different in online mode as compared to being printed on paper or exported to Excel or PDF. For example, totals at the bottom, page breaks, running totals, headers, and footers are items to pay attention to. That's why it's very important to test all of these scenarios and explain to the end user how to use the report.
Even when the user specifically asks for only Excel and PDF it is important to test other renderings and run any issues that you see by the users, to make sure they don't come back later if they see a problem with the other rendering options.
Microsoft has published design guidelines you can follow when you create a layout for a report. This is especially important when you develop document and list reports. By following these guidelines, you can make sure that your reports are:
Simple and clean
Easy to scan and read
Professional and consistent
Applying these guidelines has the advantage that you can use a minimum set of rules, by using the default formatting options available in Visual Studio. You can also create report layout templates that you can apply by report type so that all your reports have a standard look and feel and give a consistent user experience.
Note
More information about the report design guidelines is available here:
https://msdn.microsoft.com/en-us/library/jj651616(v=nav.70).aspx
Microsoft followed these guidelines, in some reports, when they developed the report layouts in Dynamics NAV 2013. In most implementations of Dynamics NAV, document reports are customized and this process can be time-consuming. The idea was to provide layouts that could be used out of the box in real life. I will leave it up to you to decide if this is true.