Book Image

Mastering Data Visualization with Microsoft Visio Professional 2016

By : John Marshall, David Parker
Book Image

Mastering Data Visualization with Microsoft Visio Professional 2016

By: John Marshall, David Parker

Overview of this book

Microsoft Visio Professional is a data visualization application that is used by many different market sectors and many different departments to represent information visually, from network infrastructure to organization charts, from process diagrams to office layouts. Starting off with a brief introduction to Visio Professional 2016 and then moving on to data storage, linking data to shapes, and working with SQL Server to create a solid foundation. Then we’ll cover topics such as refreshing data, working with geographical data, working with various graphics, and diagrams, and more. Finally, you’ll find out how to deploy custom stencils, templates, and code.
Table of Contents (17 chapters)
Mastering Data Visualization with Microsoft Visio Professional 2016
Credits
About the Author
www.PacktPub.com
Preface
Index

Displaying data with graphics


The following screenshot from Visio Professional 2016 shows default Data Graphics being applied to a simple rectangle when the row from the External Data window is dragged and dropped on to it:

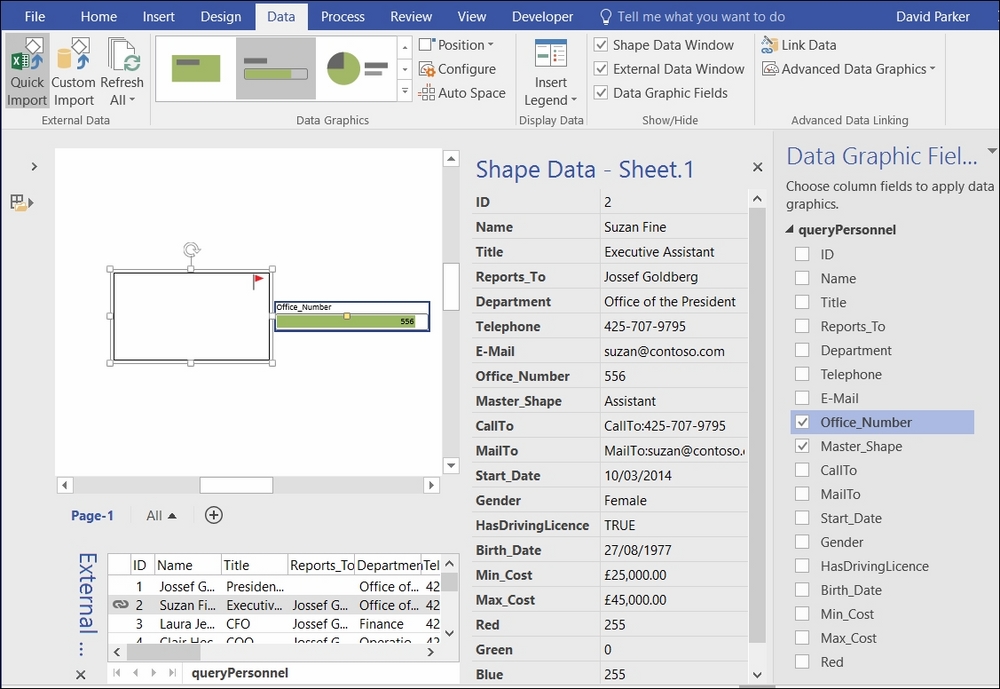
Visio Professional 2016 added the Data Graphics group to the Data ribbon tab. Apart from the Auto Space button, everything on this ribbon group has been available in all Professional (and Premium) editions since Visio 2007 on the Data Graphics button. This button has now been renamed Advanced Data Graphics, made smaller, and pushed into the Advanced Data Linking group.

The Data Graphic Fields panel, on the far right in the previous screenshot, is also new in Visio 2016. It lists all of the visible DataRecordsets that are in the document, with a checkable list of each visible field/column.

The Data Graphics drop-down gallery, also new in Visio 2016, provides the ability to easily apply a graphic item from one of the four types, as shown in the following screenshot, to the...