Book Image

Mastering Data Visualization with Microsoft Visio Professional 2016

By : John Marshall, David Parker
Book Image

Mastering Data Visualization with Microsoft Visio Professional 2016

By: John Marshall, David Parker

Overview of this book

Microsoft Visio Professional is a data visualization application that is used by many different market sectors and many different departments to represent information visually, from network infrastructure to organization charts, from process diagrams to office layouts. Starting off with a brief introduction to Visio Professional 2016 and then moving on to data storage, linking data to shapes, and working with SQL Server to create a solid foundation. Then we’ll cover topics such as refreshing data, working with geographical data, working with various graphics, and diagrams, and more. Finally, you’ll find out how to deploy custom stencils, templates, and code.
Table of Contents (17 chapters)
Mastering Data Visualization with Microsoft Visio Professional 2016
Credits
About the Author
www.PacktPub.com
Preface
Index

Adding data-linked shapes to lists


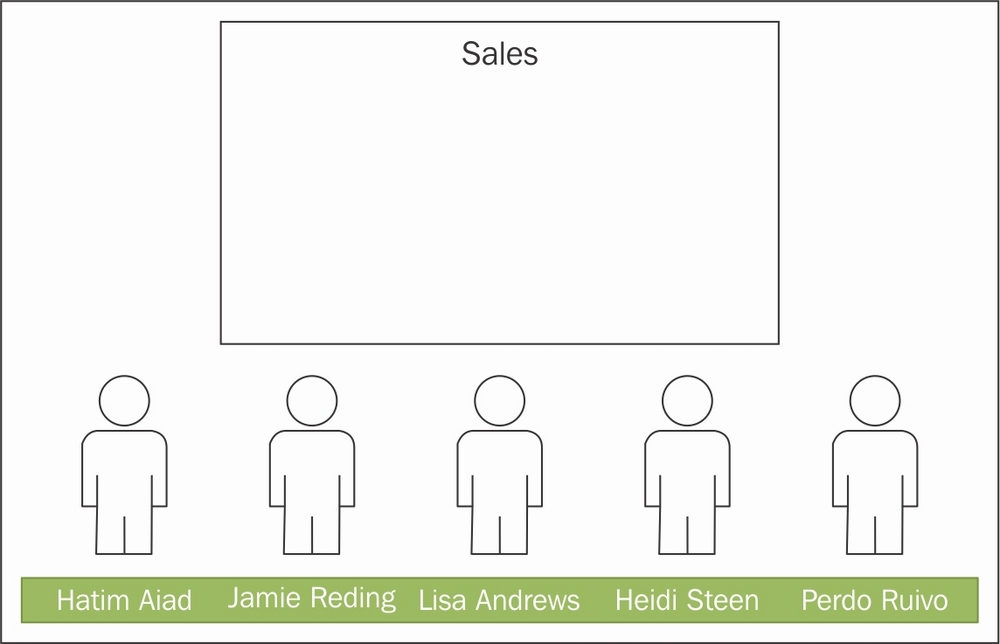
Lists are a special type of container. Each item in a list is ordered from left to right, right to left, top to bottom, or bottom to top. These are the settings that can be applied to the list. In the following screenshot, the Sales container has been changed to a list ordering from left to right:

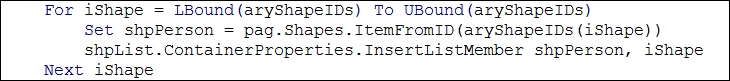
The code is almost identical for DropShapesInContainer(), except that the rows that move the Person shapes into the center of the container are replaced with the action to insert them into a list.

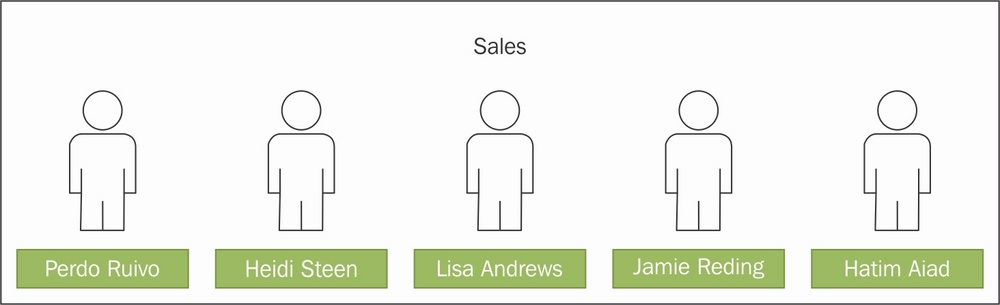
This results in the Person shapes being neatly aligned within the list container, as shown in the following screenshot. There is no need to lay out the shapes, of course.

In reality, the Person shapes will be ordered according to some rule, rather than just looping through DataRecordset.

Note

For more uses of lists in Visio diagrams, see http://blog.bvisual.net/2014/12/31/get-scrabbled-with-visio/.