

The Splunk dashboard has the option of dragging and dropping panels from controls. Splunk automatically resizes the panel equally as per the number of panels in a row. Now, you will learn to customize the dashboard panel's width and group more than one visualization in a single panel.
Let's first understand the need for customizing panel width explicitly when Splunk automatically resizes the panel by itself with the help of an example.
In the following figure, there are three panels in a single row. Panel 1 has Statistical Table, Panel 2 has Line Chart, and Panel 3 has Single Value. Splunk's smart dashboard capability automatically resizes each panel of equal sizes in a row. In the following example, it can be seen that Panel 3 has very less information to display, whereas Panel 2 requires more space to display information properly and efficiently:
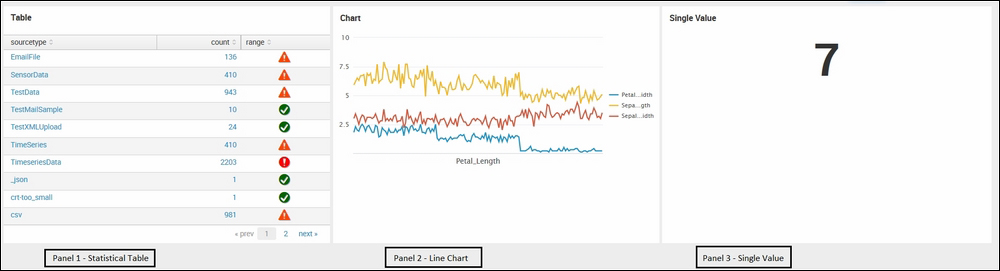
Hence, in order to make the dashboard display the required information efficiently, such as the panel that...