Book Image

Practical Predictive Analytics

By : Ralph Winters
Book Image

Practical Predictive Analytics

By: Ralph Winters

Overview of this book

This is the go-to book for anyone interested in the steps needed to develop predictive analytics solutions with examples from the world of marketing, healthcare, and retail. We'll get started with a brief history of predictive analytics and learn about different roles and functions people play within a predictive analytics project. Then, we will learn about various ways of installing R along with their pros and cons, combined with a step-by-step installation of RStudio, and a description of the best practices for organizing your projects. On completing the installation, we will begin to acquire the skills necessary to input, clean, and prepare your data for modeling. We will learn the six specific steps needed to implement and successfully deploy a predictive model starting from asking the right questions through model development and ending with deploying your predictive model into production. We will learn why collaboration is important and how agile iterative modeling cycles can increase your chances of developing and deploying the best successful model. We will continue your journey in the cloud by extending your skill set by learning about Databricks and SparkR, which allow you to develop predictive models on vast gigabytes of data.
Table of Contents (19 chapters)
Title Page
Credits
About the Author
About the Reviewers
www.PacktPub.com
Customer Feedback
Preface

Plotting future values with confidence bands


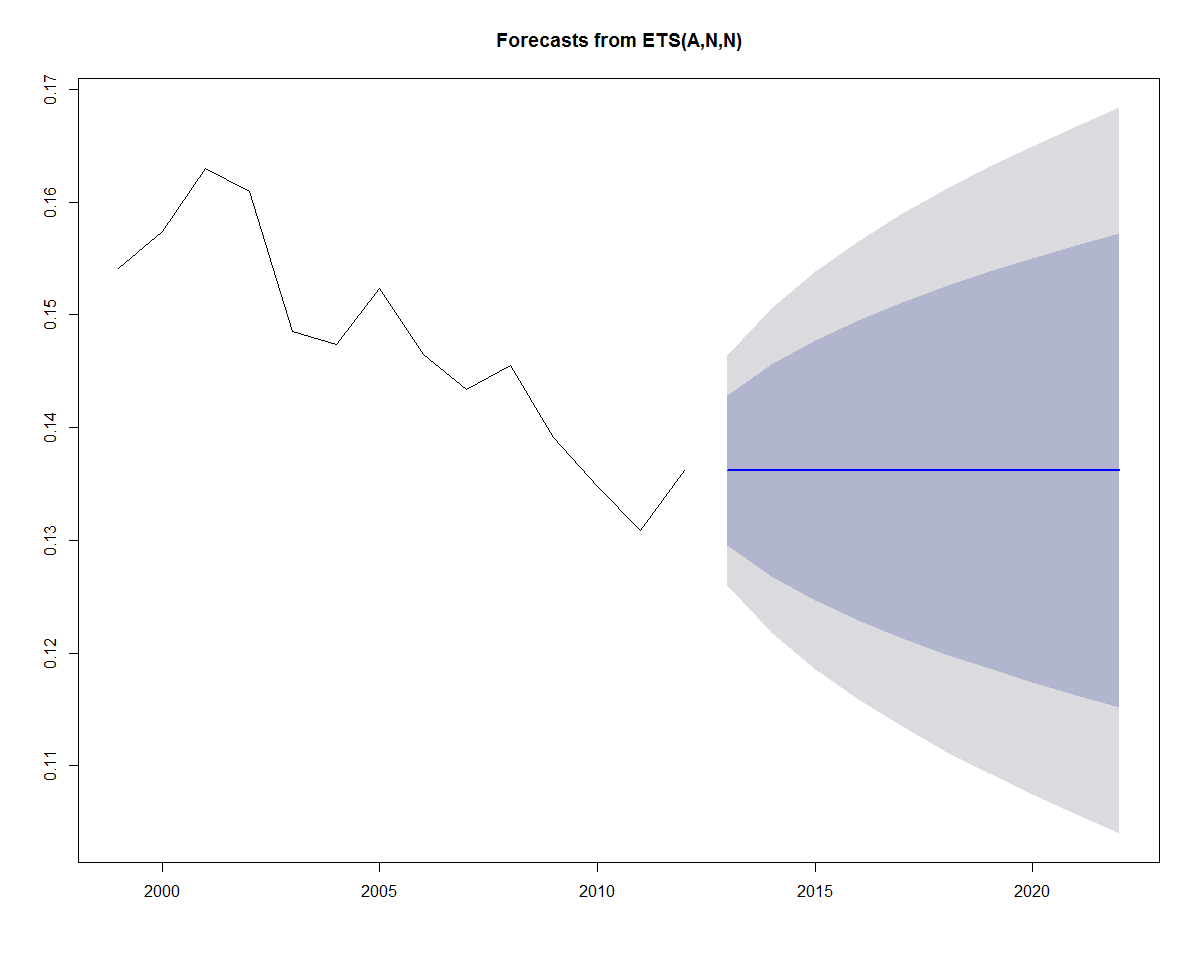
Use the plot function to plot future predictions. Notice that the prediction for the last value encompasses upper and lower confidence bands surrounding a horizontal prediction line. But why a horizontal prediction line? This is saying that there is no trend or seasonality for the exponential model, and that the best prediction is based upon the last value of the smoothed average. However, we can see that there is significant variation to the prediction, based upon the confidence bands. The confidence bands will also increase in size as the forecast period increases, to reflect the uncertainty associated with the forecast:

plot(forecast(fit))