
It is a common misconception that only those with a PhD or geniuses can understand the math/programming behind data science. This is absolutely false. Understanding data science begins with three basic areas:
The following Venn diagram provides a visual representation of how the three areas of data science intersect:
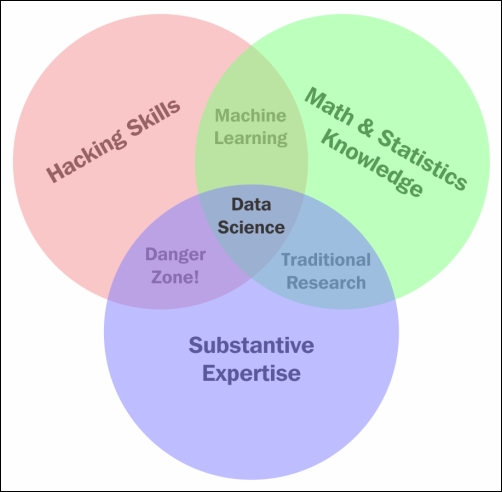
The Venn diagram of data science
Those with hacking skills can conceptualize and program complicated algorithms using computer languages. Having a Math & Statistics Knowledge base allows you to theorize and evaluate algorithms and tweak the existing procedures to fit specific situations. Having Substantive Expertise (domain expertise) allows you to apply concepts and results in a meaningful and effective way.
While having only two of these three qualities can make you intelligent, it will also leave a gap. Consider that you are very skilled in coding and have formal training in day trading. You might create an automated system to trade in your place but lack the math skills to evaluate your algorithms and, therefore, end up losing money in the long run. It is only when you can boast skills in coding, math, and domain knowledge that you can truly perform data science.
The one that was probably a surprise for you was Domain Knowledge. It is really just knowledge of the area you are working in. If a financial analyst started analyzing data about heart attacks, they might need the help of a cardiologist to make sense of a lot of the numbers.
Data Science is the intersection of the three key areas mentioned earlier. In order to gain knowledge from data, we must be able to utilize computer programming to access the data, understand the mathematics behind the models we derive, and above all, understand our analyses' place in the domain we are in. This includes the presentation of data. If we are creating a model to predict heart attacks in patients, is it better to create a PDF of information or an app where you can type in numbers and get a quick prediction? All these decisions must be made by the data scientist.
Note
Also, note that the intersection of math and coding is machine learning. This book will look at machine learning in great detail later on but it is important to note that without the explicit ability to generalize any models or results to a domain, machine learning algorithms remain just that, algorithms sitting on your computer. You might have the best algorithm to predict cancer. You could be able to predict cancer with over 99% accuracy based on past cancer patient data but if you don't understand how to apply this model in a practical sense such that doctors and nurses can easily use it, your model might be useless.
Both computer programming and math are covered extensively in this book. Domain knowledge comes with both practice of data science and reading examples of other people's analyses.
Most people stop listening once someone says the word math. They'll nod along in an attempt to hide their utter disdain for the topic. This book will guide you through the math needed for data science, specifically statistics and probability. We will use these subdomains of mathematics to create what are called models.
A data model refers to an organized and formal relationship between elements of data, usually meant to simulate a real-world phenomenon.
Essentially, we will use math in order to formalize relationships between variables. As a former pure mathematician and current math teacher, I know how difficult this can be. I will do my best to explain everything as clearly as I can. Between the three areas of data science, math is what allows us to move from domain to domain. Understanding the theory allows us to apply a model that we built for the fashion industry to a financial model.
The math covered in this book ranges from basic algebra to advanced probabilistic and statistical modeling. Do not skip over these chapters, even if you already know it or you're afraid of it. Every mathematical concept I introduce, I do so with care, examples, and purpose. The math in this book is essential for data scientists.
In biology, we use, among many others, a model known as the spawner-recruit model to judge the biological health of a species. It is a basic relationship between the number of healthy parental units of a species and the number of new units in the group of animals. In a public dataset of the number of salmon spawners and recruits, the following graph was formed to visualize the relationship between the two. We can see that there definitely is some sort of positive relationship (as one goes up, so does the other). But how can we formalize this relationship? For example, if we knew the number of spawners in a population, could we predict the number of recruits that group would obtain, and vice versa?
Essentially, models allow us to plug in one variable to get the other. Consider the following example:
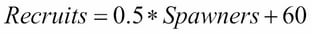
In this example, let's say we knew that a group of salmons had 1.15 (in thousands) of spawners. Then, we would have the following:
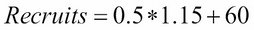
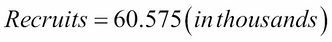
This result can be very beneficial to estimate how the health of a population is changing. If we can create these models, we can visually observe how the relationship between the two variables can change.
There are many types of data models, including probabilistic and statistical models. Both of these are subsets of a larger paradigm, called machine learning. The essential idea behind these three topics is that we use data in order to come up with the best model possible. We no longer rely on human instincts, rather, we rely on data.
The spawner-recruit model visualized
The purpose of this example is to show how we can define relationships between data elements using mathematical equations. The fact that I used salmon health data was irrelevant! Throughout this book, we will look at relationships involving marketing dollars, sentiment data, restaurant reviews, and much more. The main reason for this is that I would like you (the reader) to be exposed to as many domains as possible.
Math and coding are vehicles that allow data scientists to step back and apply their skills virtually anywhere.
Let's be honest. You probably think computer science is way cooler than math. That's ok, I don't blame you. The news isn't filled with math news like it is with news on the technological front. You don't turn on the TV to see a new theory on primes, rather, you will see investigative reports on how the latest smartphone can take photos of cats better or something. Computer languages are how we communicate with the machine and tell it to do our bidding. A computer speaks many languages and, like a book, can be written in many languages; similarly, data science can also be done in many languages. Python, Julia, and R are some of the many languages available to us. This book will focus exclusively on using Python.
We will use Python for a variety of reasons:
Python is an extremely simple language to read and write, even if you've never coded before, which will make future examples easy to ingest and read later on, even after you have read this book
It is one of the most common languages, both in production and in the academic setting (one of the fastest growing, as a matter of fact)
The language's online community is vast and friendly. This means that a quick Google search should yield multiple results of people who have faced and solved similar (if not exactly the same) situations
Python has prebuilt data science modules that both the novice and the veteran data scientist can utilize
The last is probably the biggest reason we will focus on Python. These prebuilt modules are not only powerful, but also easy to pick up. By the end of the first few chapters, you will be very comfortable with these modules. Some of these modules are as follows:
pandassci-kit learnseabornnumpy/scipyrequests(to mine data from the Web)BeautifulSoup(for the Web-HTML parsing)
Before we move on, it is important to formalize many of the requisite coding skills in Python.
In Python, we have variables that are placeholders for objects. We will focus on only a few types of basic objects at first:
int(an integer)Examples: 3, 6, 99, -34, 34, 11111111
float(a decimal):Examples: 3.14159, 2.71, -0.34567
boolean(eitherTrueorFalse)The statement, Sunday is a weekend, is
TrueThe statement, Friday is a weekend, is
FalseThe statement, pi is exactly the ratio of a circle's circumference to its diameter, is
True(crazy, right?)
string(text or words made up of characters)"I love hamburgers" (by the way, who doesn't?)
"Matt is awesome"
A Tweet is a string
list(a collection of objects)Example: [1, 5.4, True, "apple"]
We will also have to understand some basic logistical operators. For these operators, keep the boolean datatype in mind. Every operator will evaluate to either True or False. Let's take a look at the following illustrations:
==evaluates toTrueif both sides are equal; otherwise it evaluates toFalse3 + 4 == 7 (will evaluate to
True)3 – 2 == 7 (will evaluate to
False)
<(less than)3 < 5 (
True)5 < 3 (
False)
<=(less than or equal to)3 <= 3 (
True)5 <= 3 (
False)
>(greater than)3 > 5 (
False)5 > 3 (
True)
>=(greater than or equal to)3 >= 3 (
True)5 >= 3 (
False)
When coding in Python, I will use a pound sign (#) to create a "comment," which will not be processed as code but is merely there to communicate with the reader. Anything to the right of a # sign is a comment on the code being executed.
In Python, we use spaces/tabs to denote operations that belong to other lines of code.
Tip
Note the use of the if statement. It means exactly what you think it means. When the statement after the if statement is True, then the tabbed part under it will be executed, as shown in the following code:
X = 5.8
Y = 9.5

X + Y == 15.3  # This is True!

X - Y == 15.3  # This is False!
5if x + y == 15.3:   # If the statement is true:
  print "True!"     # print something!
The print "True!" statement belongs to the if x + y == 15.3: line preceding it because it is tabbed right under it. This means that the print statement will be executed if and only if x + y equals 15.3.
Note that the following list variable, my_list, can hold multiple types of objects. This one has an int, a float, boolean, and string inputs (in that order):
my_list = [1, 5.7, True, "apples"]

len(my_list) == 4  # 4 objects in the list

my_list[0] == 1    # the first object


my_list[1] == 5.7    # the second object
In the preceding code:
I used the
lencommand to get the length of the list (which was four).Note the zero-indexing of Python. Most computer languages start counting at zero instead of one. So if I want the first element, I call the index zero, and if I want the 95th element, I call the index 94.
Here is some more Python code. In this example, I will be parsing some tweets about stock prices (one of the important case studies in this book will be trying to predict market movements based on popular sentiment regarding stocks on social media):
tweet = "RT @j_o_n_dnger: $TWTR now top holding for
             Andor, unseating $AAPL"

words_in_tweet = first_tweet.split(' ') # list of words in tweet

for word in words_in_tweet:             # for each word in list
  if "$" in word:                       # if word has a "cashtag"
  print "THIS TWEET IS ABOUT", word  # alert the user
I will point out a few things about this code snippet, line by line, as follows:
We set a variable to hold some text (known as a string in Python). In this example, the tweet in question is "
RT @robdv: $TWTR now top holding for Andor, unseating $AAPL"The
words_in_tweetvariable tokenizes the tweet (separates it by word). If you were to print this variable, you would see the following:['RT', '@robdv:', '$TWTR', 'now', 'top', 'holding', 'for', 'Andor,', 'unseating', '$AAPL']
We iterate through this list of words. This is called a
forloop. It just means that we go through a list one by one.Here, we have another
ifstatement. For each word in this tweet, if the word contains the$character (this is how people reference stock tickers on Twitter).If the preceding if statement is
true(that is, if the tweet contains a cashtag), print it and show it to the user.
The output of this code will be as follows:
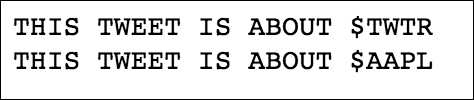
We get this output as these are the only words in the tweet that use the cashtag. Whenever I use Python in this book, I will ensure that I am as explicit as possible about what I am doing in each line of code.
As I mentioned earlier, this category focuses mainly on having knowledge about the particular topic you are working on. For example, if you are a financial analyst working on stock market data, you have a lot of domain knowledge. If you are a journalist looking at worldwide adoption rates, you might benefit from consulting an expert in the field. This book will attempt to show examples from several problem domains, including medicine, marketing, finance, and even UFO sightings!
Does that mean that if you're not a doctor, you can't work with medical data? Of course not! Great data scientists can apply their skills to any area, even if they aren't fluent in it. Data scientists can adapt to the field and contribute meaningfully when their analysis is complete.
A big part of domain knowledge is presentation. Depending on your audience, it can greatly matter how you present your findings. Your results are only as good as your vehicle of communication. You can predict the movement of the market with 99.99% accuracy, but if your program is impossible to execute, your results will go unused. Likewise, if your vehicle is inappropriate for the field, your results will go equally unused.