Book Image

Principles of Data Science

Book Image

Principles of Data Science

Overview of this book

Need to turn your skills at programming into effective data science skills? Principles of Data Science is created to help you join the dots between mathematics, programming, and business analysis. With this book, you’ll feel confident about asking—and answering—complex and sophisticated questions of your data to move from abstract and raw statistics to actionable ideas. With a unique approach that bridges the gap between mathematics and computer science, this books takes you through the entire data science pipeline. Beginning with cleaning and preparing data, and effective data mining strategies and techniques, you’ll move on to build a comprehensive picture of how every piece of the data science puzzle fits together. Learn the fundamentals of computational mathematics and statistics, as well as some pseudocode being used today by data scientists and analysts. You’ll get to grips with machine learning, discover the statistical models that help you take control and navigate even the densest datasets, and find out how to create powerful visualizations that communicate what your data means.
Table of Contents (20 chapters)
Principles of Data Science
Credits
About the Author
About the Reviewers
www.PacktPub.com
Preface
Index

The Empirical rule


Recall that a normal distribution is defined as having a specific probability distribution that resembles a bell curve. In statistics, we love it when our data behaves normally. For example, if we have data that resembles a normal distribution, like so:

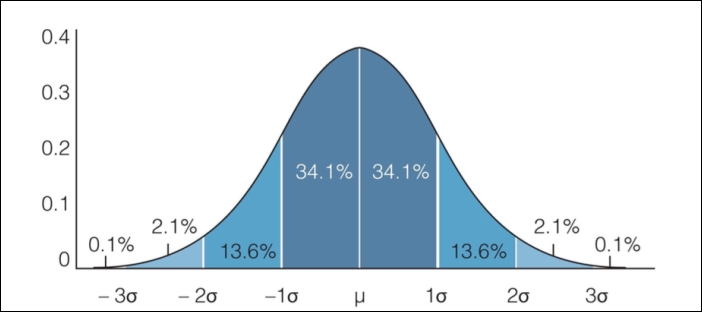
The Empirical rule states that we can expect a certain amount of data to live between sets of standard deviations. Specifically, the Empirical rule states for data that is distributed normally:

  • about 68% of the data fall within 1 standard deviation

  • about 95% of the data fall within 2 standard deviations

  • about 99.7% of the data fall within 3 standard deviations

For example, let's see if our Facebook friends' data holds up to this. Let's use our Dataframe to find the percentage of people that fall within 1, 2, and 3 standard deviations of the mean, as shown:

# finding the percentage of people within one standard deviation of the mean
within_1_std = df_scaled[(df_scaled['friends_scaled'] <= 1) & (df_scaled['friends_scaled...