Book Image

Principles of Data Science

Book Image

Principles of Data Science

Overview of this book

Need to turn your skills at programming into effective data science skills? Principles of Data Science is created to help you join the dots between mathematics, programming, and business analysis. With this book, you’ll feel confident about asking—and answering—complex and sophisticated questions of your data to move from abstract and raw statistics to actionable ideas. With a unique approach that bridges the gap between mathematics and computer science, this books takes you through the entire data science pipeline. Beginning with cleaning and preparing data, and effective data mining strategies and techniques, you’ll move on to build a comprehensive picture of how every piece of the data science puzzle fits together. Learn the fundamentals of computational mathematics and statistics, as well as some pseudocode being used today by data scientists and analysts. You’ll get to grips with machine learning, discover the statistical models that help you take control and navigate even the densest datasets, and find out how to create powerful visualizations that communicate what your data means.
Table of Contents (20 chapters)
Principles of Data Science
Credits
About the Author
About the Reviewers
www.PacktPub.com
Preface
Index

Sampling distributions


In Chapter 7, Basic Statistics, we mentioned how much we love when data follows the normal distribution. One of the reasons for this is that many statistical tests (including the ones we will use in this chapter) rely on data that follows a normal pattern, and for the most part, a lot of real-world data is not normal (surprised?). Take our employee break data for example, you might think I was just being fancy creating data using the Poisson distribution, but I had a reason for this—I specifically wanted non-normal data, as shown:

pd.DataFrame(breaks).hist(bins=50,range=(5,100))

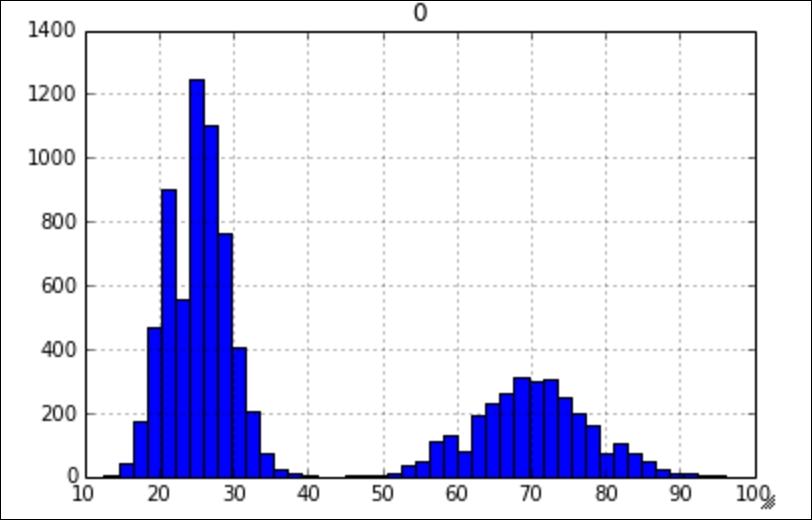
As you can see, our data is definitely not following a normal distribution, it appears to be bi-modal, which means that there are two peaks of break times, at around 25 and 70 minutes. As our data is not normal, many of the most popular statistics tests may not apply, however, if we follow the given procedure, we can create normal data! Think I'm crazy? Well, see for yourself.

First off, we will...