Book Image

Advanced Analytics with R and Tableau

By : Ruben Oliva Ramos, Jen Stirrup, Roberto Rösler
Book Image

Advanced Analytics with R and Tableau

By: Ruben Oliva Ramos, Jen Stirrup, Roberto Rösler

Overview of this book

Tableau and R offer accessible analytics by allowing a combination of easy-to-use data visualization along with industry-standard, robust statistical computation. Moving from data visualization into deeper, more advanced analytics? This book will intensify data skills for data viz-savvy users who want to move into analytics and data science in order to enhance their businesses by harnessing the analytical power of R and the stunning visualization capabilities of Tableau. Readers will come across a wide range of machine learning algorithms and learn how descriptive, prescriptive, predictive, and visually appealing analytical solutions can be designed with R and Tableau. In order to maximize learning, hands-on examples will ease the transition from being a data-savvy user to a data analyst using sound statistical tools to perform advanced analytics. By the end of this book, you will get to grips with advanced calculations in R and Tableau for analytics and prediction with the help of use cases and hands-on examples.
Table of Contents (16 chapters)
Advanced Analytics with R and Tableau
Credits
About the Authors
About the Reviewers
www.PacktPub.com
Customer Feedback
Preface
Index

Comparing actual values with predicted results


Now, we will look at real values of weight of 15 women first and then will look at predicted values. Actual values of weight of 15 women are as follows, using the following command:

women$weight

When we execute the women$weight command, this is the result that we obtain:

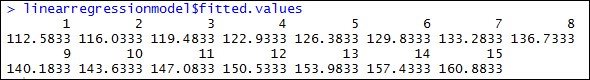
When we look at the predicted values, these are also read out in R:

How can we put these pieces of data together?

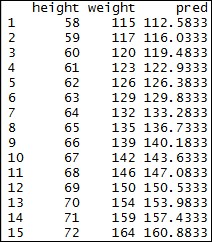
women$pred <- linearregressionmodel$fitted.values

This is a very simple merge. When we look inside the women variable again, this is the result:

Investigating relationships in the data

We can see the column names in the model by using the names command. In our example, it will appear as follows:

names(linearregressionmodel)

When we use this command, we get the following columns:

[1] "coefficients"  "residuals"     "effects"      
[4] "rank"          "fitted.values" "assign"       
[7] "qr"            "df.residual"   "xlevels"      
[10] "call"          "terms"   ...