Book Image

Advanced Analytics with R and Tableau

By : Ruben Oliva Ramos, Jen Stirrup, Roberto Rösler
Book Image

Advanced Analytics with R and Tableau

By: Ruben Oliva Ramos, Jen Stirrup, Roberto Rösler

Overview of this book

Tableau and R offer accessible analytics by allowing a combination of easy-to-use data visualization along with industry-standard, robust statistical computation. Moving from data visualization into deeper, more advanced analytics? This book will intensify data skills for data viz-savvy users who want to move into analytics and data science in order to enhance their businesses by harnessing the analytical power of R and the stunning visualization capabilities of Tableau. Readers will come across a wide range of machine learning algorithms and learn how descriptive, prescriptive, predictive, and visually appealing analytical solutions can be designed with R and Tableau. In order to maximize learning, hands-on examples will ease the transition from being a data-savvy user to a data analyst using sound statistical tools to perform advanced analytics. By the end of this book, you will get to grips with advanced calculations in R and Tableau for analytics and prediction with the help of use cases and hands-on examples.
Table of Contents (16 chapters)
Advanced Analytics with R and Tableau
Credits
About the Authors
About the Reviewers
www.PacktPub.com
Customer Feedback
Preface
Index

Neural network performance measures


In the meantime, however, let's make the concepts of the neural net clear by looking at the options for visualizing the results.

Receiver Operating Characteristic curve

Here is an example of a Receiver Operator Characteristic (ROC) curve, where we can see the data analysis and the changes we have in the data accordingly to the time.

The closer this curve is to the upper left corner, the better the model's performance is. It means it is better at identifying the true positive rate while minimizing the false positive rate. In this example, we can see that the model is performing well.

Precision and Recall curve

Precision and Recall curve are very useful for assessing models in terms of business questions. They offer more detail and insights into the model's performance. Here is an example:

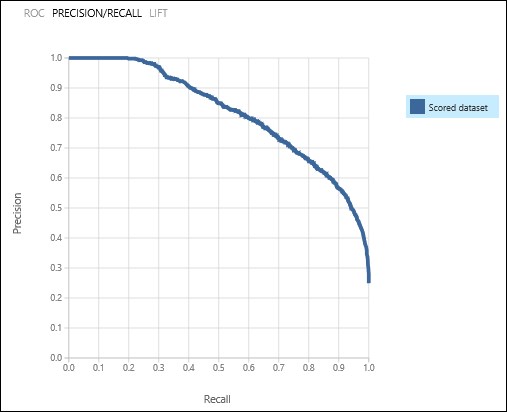
Precision can be described as the fraction of times that the model classifies the number of cases correctly. It can be considered as a measure of confirmation, and it indicates...