Book Image

Tableau 10 Business Intelligence Cookbook

By : Donabel Santos, Paul Banoub
Book Image

Tableau 10 Business Intelligence Cookbook

By: Donabel Santos, Paul Banoub

Overview of this book

Tableau is a software tool that can speed up data analysis through its rich visualization capabilities, and help uncover insights for better and smarter decision making. This book is for the business, technology, data and analytics professionals who use and analyze data and data-driven approaches to support business operations and strategic initiatives in their organizations. This book provides easy-to-follow recipes to get the reader up and running with Tableau 10, and covers basic to advanced use cases and scenarios. The book starts with building basic charts in Tableau and moves on to building more complex charts by incorporating different Tableau features and interactivity components. There is an entire chapter dedicated to dashboard techniques and best practices. A number of recipes specifically for geospatial visualization, analytics, and data preparation are also covered. By the end of this book, you’ll have gained confidence and competence to analyze and communicate data and insights more efficiently and effectively by creating compelling interactive charts, dashboards, and stories in Tableau.
Table of Contents (17 chapters)
Tableau 10 Business Intelligence Cookbook
Credits
About the Author
Acknowledgements
About the Reviewer
www.PacktPub.com
Preface
Index

Using a reference line


A reference line is simply a line that gets drawn on a chart that represents another measure or point of reference. Reference lines can be useful in providing context to the related chart. For example, a line showing the median will visually show the difference of each mark in the chart relative to the median.

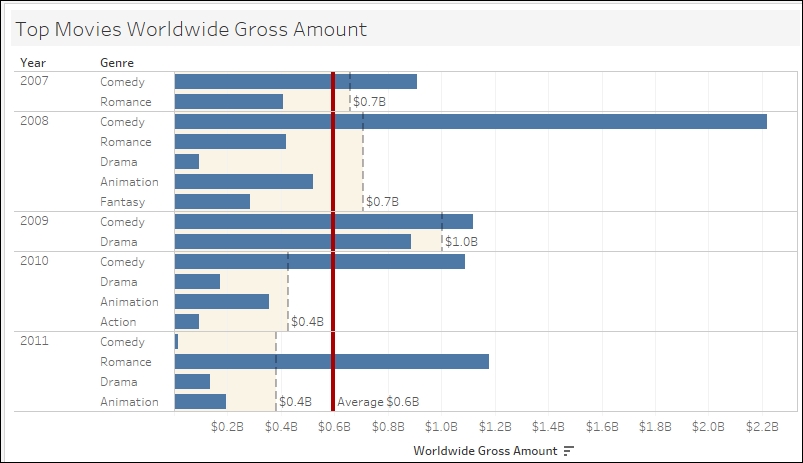
In this recipe, we will show some of the top movie genres from 2007-2011 based on worldwide gross amount and add reference lines to show the average overall and average per year:

Getting ready

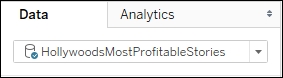
To follow this recipe, open B05527_06 – STARTER.twbx. Use the worksheet called Reference Line, and connect to the HollywoodsMostProfitableStories data source:

How to do it...

Here are the steps to create the bar graph with reference lines:

  1. From Dimensions, drag Year to Rows.

  2. From Dimensions, drag Genre to Rows to the right of the Year pill.

  3. From Measures, drag Worldwide Gross Amount to Columns.

  4. Hover over the Worldwide Gross Amount axis, and click on the sort icon once to sort the...