Book Image

Effective Business Intelligence with QuickSight

By : Rajesh Nadipalli
Book Image

Effective Business Intelligence with QuickSight

By: Rajesh Nadipalli

Overview of this book

Amazon QuickSight is the next-generation Business Intelligence (BI) cloud service that can help you build interactive visualizations on top of various data sources hosted on Amazon Cloud Infrastructure. QuickSight delivers responsive insights into big data and enables organizations to quickly democratize data visualizations and scale to hundreds of users at a fraction of the cost when compared to traditional BI tools. This book begins with an introduction to Amazon QuickSight, feature differentiators from traditional BI tools, and how it fits in the overall AWS big data ecosystem. With practical examples, you will find tips and techniques to load your data to AWS, prepare it, and finally visualize it using QuickSight. You will learn how to build interactive charts, reports, dashboards, and stories using QuickSight and share with others using just your browser and mobile app. The book also provides a blueprint to build a real-life big data project on top of AWS Data Lake Solution and demonstrates how to build a modern data lake on the cloud with governance, data catalog, and analysis. It reviews the current product shortcomings, features in the roadmap, and how to provide feedback to AWS. Grow your profits, improve your products, and beat your competitors.
Table of Contents (15 chapters)
Effective Business Intelligence with QuickSight
Credits
About the Author
About the Reviewer
www.PacktPub.com
Customer Feedback
Preface

Analyses on the go


To access your saved analyses, click on the Analyses icon from the menu at the bottom of your mobile device; you will then see a list of analyses, as shown in this screenshot:

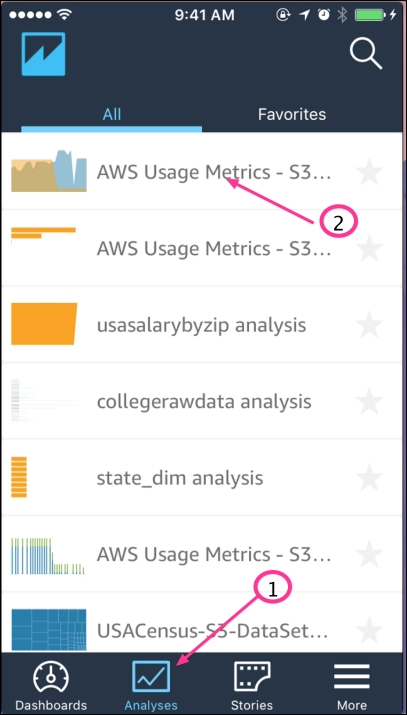
Figure 6.6: Analysis list

In the next few sections, we will review how to navigate other analysis features.

View details of your analysis

From the listing of analyses, select the AWS Usage Metrics analysis, which will then redirect you to the detailed analysis view. In the detailed view, you will see all visuals that are part of that analysis. You can click on the arrow to the extreme top right of each visual to open the specific chart in full screen mode. The visuals also come with the date slider to change the date range shown in the chart. To change the chart type for the visual, click on the bar-like icon on the bottom left, as shown in the following screenshot:

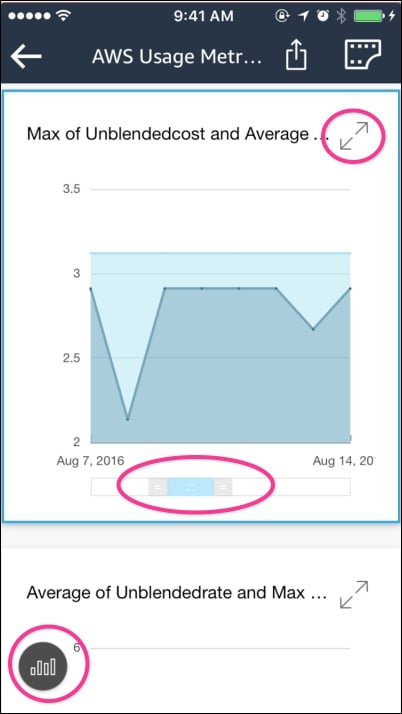
Figure 6.7: Analysis details

For the area line chart shown in the preceding screenshot, after you click to change the visuals type, you...