Book Image

Python for Finance - Second Edition

By : Yuxing Yan
5 (1)
Book Image

Python for Finance - Second Edition

5 (1)
By: Yuxing Yan

Overview of this book

This book uses Python as its computational tool. Since Python is free, any school or organization can download and use it. This book is organized according to various finance subjects. In other words, the first edition focuses more on Python, while the second edition is truly trying to apply Python to finance. The book starts by explaining topics exclusively related to Python. Then we deal with critical parts of Python, explaining concepts such as time value of money stock and bond evaluations, capital asset pricing model, multi-factor models, time series analysis, portfolio theory, options and futures. This book will help us to learn or review the basics of quantitative finance and apply Python to solve various problems, such as estimating IBM’s market risk, running a Fama-French 3-factor, 5-factor, or Fama-French-Carhart 4 factor model, estimating the VaR of a 5-stock portfolio, estimating the optimal portfolio, and constructing the efficient frontier for a 20-stock portfolio with real-world stock, and with Monte Carlo Simulation. Later, we will also learn how to replicate the famous Black-Scholes-Merton option model and how to price exotic options such as the average price call option.
Table of Contents (23 chapters)
Python for Finance Second Edition
Credits
About the Author
About the Reviewers
www.PacktPub.com
Customer Feedback
Preface
Index

Long-term return forecasting


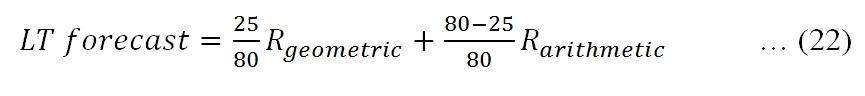
Many researchers and practitioners argue that a long-term return forecast would be overestimated if it is based on the arithmetic mean of the past returns and underestimated based on a geometric mean. Using 80 years' historical returns to forecast the next 25-year future return, Jacquier, Kane, and Marcus (2003) suggest the following weighted scheme:

The following program reflects the preceding equation:

import numpy as np
import pandas as pd
from matplotlib.finance import quotes_historical_yahoo_ochl as getData 
#
# input area
ticker='IBM'           # input value 1 
begdate=(1926,1,1)     # input value 2 
enddate=(2013,12,31)   # input value 3 
n_forecast=25          # input value 4
#
def geomean_ret(returns): 
    product = 1
    for ret in returns: 
        product *= (1+ret)
    return product ** (1.0/len(returns))-1
#
x=getData(ticker,begdate,enddate,asobject=True, adjusted=True)
logret = np.log(x.aclose[1:]/x.aclose[:-1]) 
date=[]
d0=x.date
for i in range...