Book Image

Data Analysis with IBM SPSS Statistics

By : Ken Stehlik-Barry, Anthony Babinec
Book Image

Data Analysis with IBM SPSS Statistics

By: Ken Stehlik-Barry, Anthony Babinec

Overview of this book

SPSS Statistics is a software package used for logical batched and non-batched statistical analysis. Analytical tools such as SPSS can readily provide even a novice user with an overwhelming amount of information and a broad range of options for analyzing patterns in the data. The journey starts with installing and configuring SPSS Statistics for first use and exploring the data to understand its potential (as well as its limitations). Use the right statistical analysis technique such as regression, classification and more, and analyze your data in the best possible manner. Work with graphs and charts to visualize your findings. With this information in hand, the discovery of patterns within the data can be undertaken. Finally, the high level objective of developing predictive models that can be applied to other situations will be addressed. By the end of this book, you will have a firm understanding of the various statistical analysis techniques offered by SPSS Statistics, and be able to master its use for data analysis with ease.
Table of Contents (17 chapters)
4
Dealing with Missing Data and Outliers
10
Crosstabulation Patterns for Categorical Data

Reading Excel files

Here is a snapshot of a portion of an Excel spreadsheet:

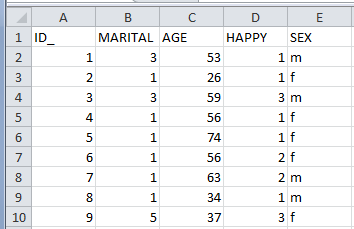
Note that row 1 of the Excel spreadsheet is a header row containing variable names for the columns.

When working with Excel spreadsheets or delimited text files, use row 1 of the file to supply variable names that you intend to use in SPSS Statistics.

IBM SPSS Statistics can directly read an Excel sheet. There are different implementations in different recent releases of IBM SPSS Statistics but, in general, the capability exists on the File menu. In IBM SPSS Statistics 24, use the following path:

File | Import Data

Here is the Read Excel File dialog box:

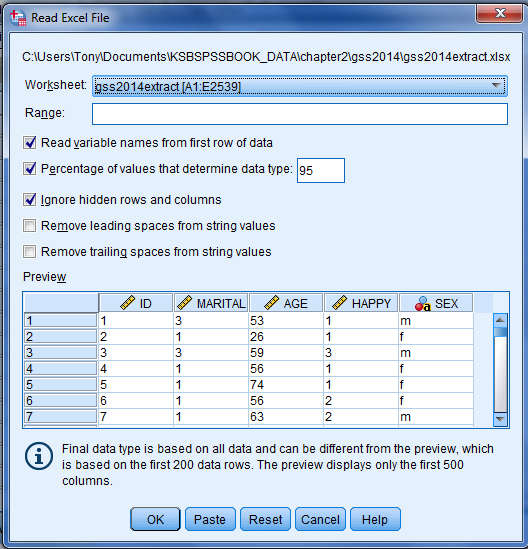
By default, IBM SPSS Statistics shows the entire range of data that it encounters in the Excel sheet. You can use the Range portion of the dialog box to specify a subset range. Also by default, IBM SPSS Statistics expects to find variable names in...