Book Image

Java Data Analysis

By : John R. Hubbard
Book Image

Java Data Analysis

By: John R. Hubbard

Overview of this book

Data analysis is a process of inspecting, cleansing, transforming, and modeling data with the aim of discovering useful information. Java is one of the most popular languages to perform your data analysis tasks. This book will help you learn the tools and techniques in Java to conduct data analysis without any hassle. After getting a quick overview of what data science is and the steps involved in the process, you’ll learn the statistical data analysis techniques and implement them using the popular Java APIs and libraries. Through practical examples, you will also learn the machine learning concepts such as classification and regression. In the process, you’ll familiarize yourself with tools such as Rapidminer and WEKA and see how these Java-based tools can be used effectively for analysis. You will also learn how to analyze text and other types of multimedia. Learn to work with relational, NoSQL, and time-series data. This book will also show you how you can utilize different Java-based libraries to create insightful and easy to understand plots and graphs. By the end of this book, you will have a solid understanding of the various data analysis techniques, and how to implement them using Java.
Table of Contents (20 chapters)
Java Data Analysis
Credits
About the Author
About the Reviewers
www.PacktPub.com
Customer Feedback
Preface
Index

Cumulative distributions


For every probability distribution function f(x), there is a corresponding cumulative distribution function (CDF), denoted by F(x) and defined as:

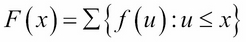
Table 4-3. Dice example

The expression on the right means to sum all the values of f(u) for u ≤ x.

The CDF for the dice example is shown in Table 4-3, and its histogram is shown in Figure 4-6:

x

fX (x)

2

1/36

3

3/36

4

6/36

5

10/36

6

15/36

7

21/36

8

26/36

9

30/36

10

33/36

11

35/36

12

36/36

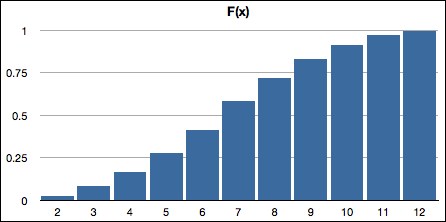
Figure 4-6. Dice cumulative distribution

The properties of a cumulative distribution follow directly from those governing probability distributions. They are:

  • 0 F(x) 1, for every x X(S)

  • F(x) is monotonically increasing; that is, F(u) F(v) for u < v

  • F(xmax) = 1

Here, xmax is the maximum x value.

The CDF can be used to compute interval probabilities more easily that the PDF. For example, consider the event that 3 < X < 9; that is, that the sum of the two dice is between 3 and 9. Using the PDF...