Book Image

Microsoft Power BI Cookbook

By : Author Test, Brett Powell
Book Image

Microsoft Power BI Cookbook

By: Author Test, Brett Powell

Overview of this book

Microsoft Power BI is a business intelligence and analytics platform consisting of applications and services designed to provide coherent, visual and interactive insights of data. This book will provide thorough, technical examples of using all primary Power BI tools and features as well as demonstrate high impact end-to-end solutions that leverage and integrate these technologies and services. Get familiar with Power BI development tools and services, go deep into the data connectivity and transformation, modeling, visualization and analytical capabilities of Power BI, and see Power BI’s functional programming languages of DAX and M come alive to deliver powerful solutions to address common, challenging scenarios in business intelligence. This book will excite and empower you to get more out of Power BI via detailed recipes, advanced design and development tips, and guidance on enhancing existing Power BI projects.
Table of Contents (14 chapters)

Configuring Power BI Desktop options and settings

Power BI Desktop is the primary tool used to develop the visual and analytical content which can then be deployed and collaborated on in the Power BI Service and optionally embedded in other applications and portals or even shared on the public internet. Although Power BI Desktop runs as a single application, it includes three tightly integrated components with their own options and settings:

  • The Get Data and Query Editor experience, with its underlying M language and data mashup engine
  • The SQL Server Analysis Services (SSAS) tabular data modeling engine and its DAX analytical language
  • The interactive reporting and visualization engine formerly known as Power View

Configuring and leveraging these capabilities, in addition to advanced analytics and customization features such as R, mobile layout, and natural language queries, makes it possible to build robust and elegant BI and analytics solutions.

Getting ready

Most organizations set policies restricting downloads of software from the internet and many choose to centrally distribute a specific version of Power BI Desktop. For example, the March 2017 version of Power BI Desktop would be available on a corporate IT portal and it would be the approved version for 1-2 months while the April 2017 version is internally evaluated. Additionally, BI organizations may define policies restricting the use of native queries, custom visualizations, and establishing source privacy level settings.

How to do it...

Power BI Desktop is a relatively large download at 110 MB but can be installed simply and provides an intuitive Options and Settings interface for configuration.

Installing and running Power BI Desktop

  1. Download the Power BI Desktop installer package. The Windows installer package (.msi) can be downloaded from the Power BI Service or from the Power BI downloads page (https://powerbi.microsoft.com/en-us/downloads/).
Figure 1: Download from the Power BI Service

The Download dropdown, along with Settings and Notifications, is available in the upper-right corner of the Power BI Service window. The On-Premises Data Gateway and Power BI Publisher for Excel described later this chapter are also available for download.

Figure 2: Downloaded Installer Package for 64-bit Power BI Desktop

The web service will determine whether the 64-bit (x64) or 32-bit version of Power BI Desktop is appropriate for your machine's operating system. If Power BI Desktop has already been installed on your machine and notifications of new versions are enabled, you will have the option to initiate the download of the latest Power BI Desktop version when it's available. Notifications of new versions are enabled by default and available under Global Options | Updates.

  1. Install Power BI Desktop. Launch the installation wizard from the .msi package and complete the installation after accepting the license agreement and choosing the file directory.
Figure 3: Successful Installation of Power BI Desktop

Configuring Power BI Desktop options

Developers of Power BI content should become familiar with the settings available in Power BI options and data source settings as these configurations determine available functionality, user interface options, default behaviors, performance, and the security of the data being accessed.

Figure 4: Power BI Desktop Options (July 2017)

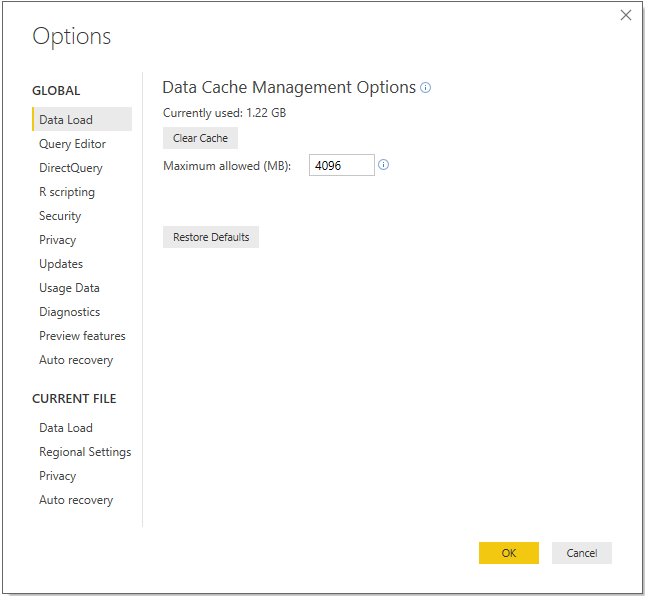
GLOBAL options are applied to all Power BI Desktop files created or accessed by the user, while CURRENT FILE options must be defined for each Power BI Desktop file. The following steps are recommended for GLOBAL options.

  1. On the Data Load tab, confirm that the currently used data cache is below the Maximum allowed (MB) setting. If it is near the limit and local disk space is available, increase the value of the Maximum allowed (MB). Do not clear the cache unless local disk space is unavailable as this will require additional, often unnecessary, queries to be executed at design time.
Figure 5: Global Data Load options
  1. On the Query Editor tab, display both the query settings pane and the formula bar. This will allow for greater visibility to the structure and specific M functions utilized by individual queries.
Figure 6: Global Query Editor options
  1. On the DirectQuery tab, enable the Allow unrestricted measures in DirectQuery mode setting.
Figure 7: Global DirectQuery options
This enables additional DAX functions to be used in metrics against DirectQuery data models that are necessary to meet many common requirements. Although all DAX functions are supported for DirectQuery models, certain functions are not optimized for DirectQuery; they may not generate an efficient SQL query and may require local, single-threaded resources to execute. For this reason, among others discussed in Chapter 3, Building a Power BI Data Model, the default Import mode is often a better option than DirectQuery for more complex data models.
  1. On the Security tab, select the option to require user approval for new native database queries. Native queries are the user-specified SQL statements passed to data sources as opposed to the queries Power BI generates internally.
Figure 8: Security Option for Native Database Queries
  • Optionally, set Show security warning when adding a custom visual to a report as well.
From a security standpoint, custom visuals can be divided between those developed by Microsoft, those developed by third parties but available in the Office Store, and finally those developed by third parties but available exclusively from sources outside the Office Store. Custom visuals developed by Microsoft have been thoroughly tested for safety. Third-party custom visuals available in the Office Store have been through a validation process though there is no guarantee that all code paths have been tested. Third-party visuals not available in the Office Store should therefore be used with caution and it's recommended to establish a policy regarding the use of custom visuals.
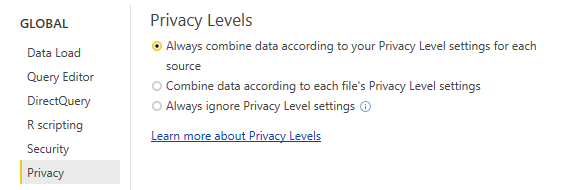
  1. On the privacy tab, configure the privacy levels for all data sources and enable the option to Always combine data according to your Privacy Level settings for each source. See How it Works... for details on these settings.
Figure 9: Global Privacy Level Options
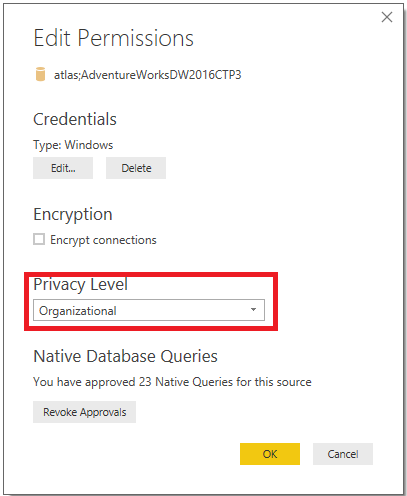
  1. From the Data Source settings, select an individual source and choose Edit Permissions to configure the privacy level:
Figure 10: Edit Permissions of a Data Source
The Edit Permissions dialog is also required to update credentials as data source system credentials expire or password resets are required.

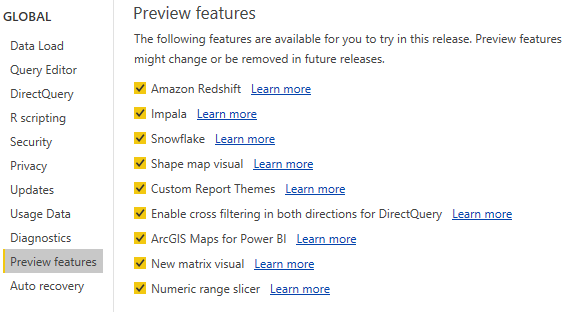
  1. Enable Preview features for evaluation purposes:
Figure 11: Preview Features available with the March 2017 Release of Power BI Desktop
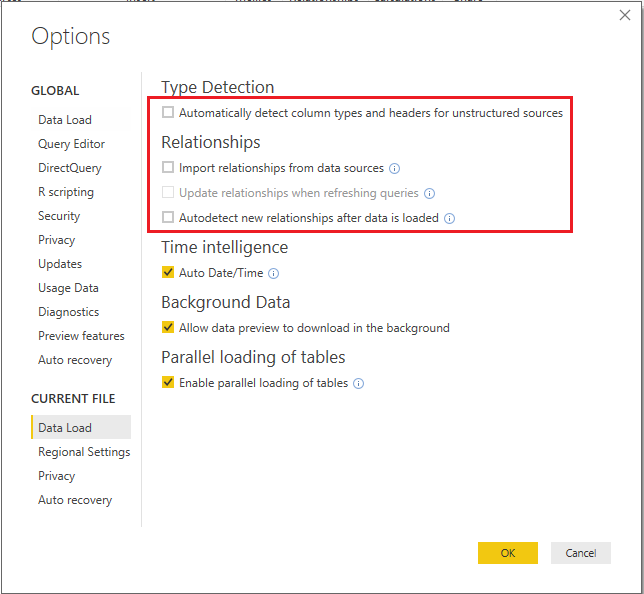
  1. On the Data Load tab for the CURRENT FILE, disable the automatic detection of column types and relationships. These model design decisions should be implemented explicitly by the Power BI developer with knowledge of the source data.
Figure 12: Disabled Relationships Options for the Current File
  • As the current file options, it's necessary to apply these settings with each Power BI Desktop file to avoid default behaviors.
For example, the default detection of column types from unstructured sources such as text or Excel files will create a hardcoded dependency on the column names in the source file. Additionally, this default transformation will be applied prior to any filter expression and thus can require more time and resources to perform the refresh.

How it works...

Defining data source privacy levels such as Organizational or Private prevents the data from these sources being exposed to external or inappropriate data sources during data retrieval processes. For example, if a query calls for merging a Private data source with a Public data source, the join operation will be executed locally--the private data will not be sent to the public source. In the absence of Privacy Level settings set for data sources, the M query engine will look to optimize for performance by utilizing source system resources.

The options under Preview features change with new versions as some previous options become generally available and new preview features are introduced. The monthly Power BI Desktop update video and blog post provides details and examples of these new features. Usually a restart of the Power BI Desktop application is required once a new preview option has been activated, and tooltips and dialogs in Power BI Desktop will advise you if a preview feature is being used.

The enable tracing option in the Diagnostic Options section writes out detailed trace event data to the local hard drive and thus should only be activated for complex troubleshooting scenarios.

Figure 13: Global Diagnostics Options

There's more...

As a modern cloud and service-oriented analytics platform, Power BI delivers new and improved features across its toolset on a monthly cadence. These scheduled releases and updates for Power BI Desktop, the Power BI Service, the On-Premises Data Gateway, Power BI mobile applications, and more reflect customer feedback, industry trends, and the Power BI team's internal ideas and product roadmap.

BI professionals responsible for developing and managing Power BI content can both stay informed of these updates as well as review detailed documentation and guidance on implementing the features via the Microsoft Power BI Blog (http://bit.ly/20bcQb4), Power BI Documentation (http://bit.ly/2o22qi4), and the Power BI Community (http://bit.ly/2mqiuxP).

Figure 14: Blog post and supporting video for the March 2017 update to Power BI Desktop

The Power BI Community portal provides a robust, searchable hub of information across common topics as well as an active, moderated forum of user experiences and troubleshooting. The community also maintains its own blog featuring examples and use cases from top community contributors, and links to local Power BI User Groups (PUGs) and relevant events such as Microsoft Data Insights Summit.

See also

Power BI's advantages over Excel

Although Power BI Desktop and Excel 2016 both contain the same data transformation and modeling BI engines (M and DAX, respectively), features exclusive to Power BI Desktop and the features in the Power BI Service exclusive to datasets created from Power BI Desktop create an incentive to migrate existing Excel data models and queries to Power BI Desktop. At the time of writing, those top incremental features and benefits are the following:

Row-level security roles Custom third-party Visuals
DirectQuery Data models Data-Driven Alerts
Max Size of 1 GB per dataset* Quick Insights
Interactive reports* Interactive Mobile Reports
Bidirectional relationships Mobile report layouts
Natural language queries Advanced analytics with R
Power BI report templates Custom Report Themes
The maximum size of an Excel dataset that can be published to Power BI is 250 MB, compared to 1 GB for Power BI Desktop. With Power BI Premium, even larger Power BI datasets will be supported (ie 10GB, 100GB). Additionally, Excel reports created via connections to external data sources such as Analysis Services databases or published Power BI datasets are not interactive when published to Power BI (that is, slicers or drill down) and their data does not update with refreshes to the source dataset. Therefore, only Excel reports based on the more limited Excel data model can be published to include interactivity and the scheduled refresh. Additionally, new features added or improved in Power BI Desktop's monthly update cycle such as new M or DAX functions become available to Excel in Office 365 subscription updates. Thus, even with the latest Office 365 update, new features may not be available in Excel for months.

Power BI Security and Data Source Privacy