
Spyder—which is an acronym for Scientific PYthon Development EnviRonment—is an IDE specifically designed for Python and SciPy. It provides an out-of-the box solution for developing projects that use NumPy, SciPy, pandas, and other scientific or data-oriented Python libraries.
Running SciPy in Spyder
Getting ready
Spyder is included in the default Anaconda distribution, so, if you are using Anaconda, you already have Spyder.
If not, you can install it with pip using the following commands:
pip3 install PyQt5
pip3 install spyder
Note that depending on your configuration, you may already have PyQt5 installed, but attempting to install it again will do no harm. pip3 will only tell you that the package is already present.
How to do it...
The first step is to start Spyder by running the following command from the command line:
spyder
After a few moments, the Spyder home window will appear on your screen, displaying an environment similar to the one shown in the following screenshot:
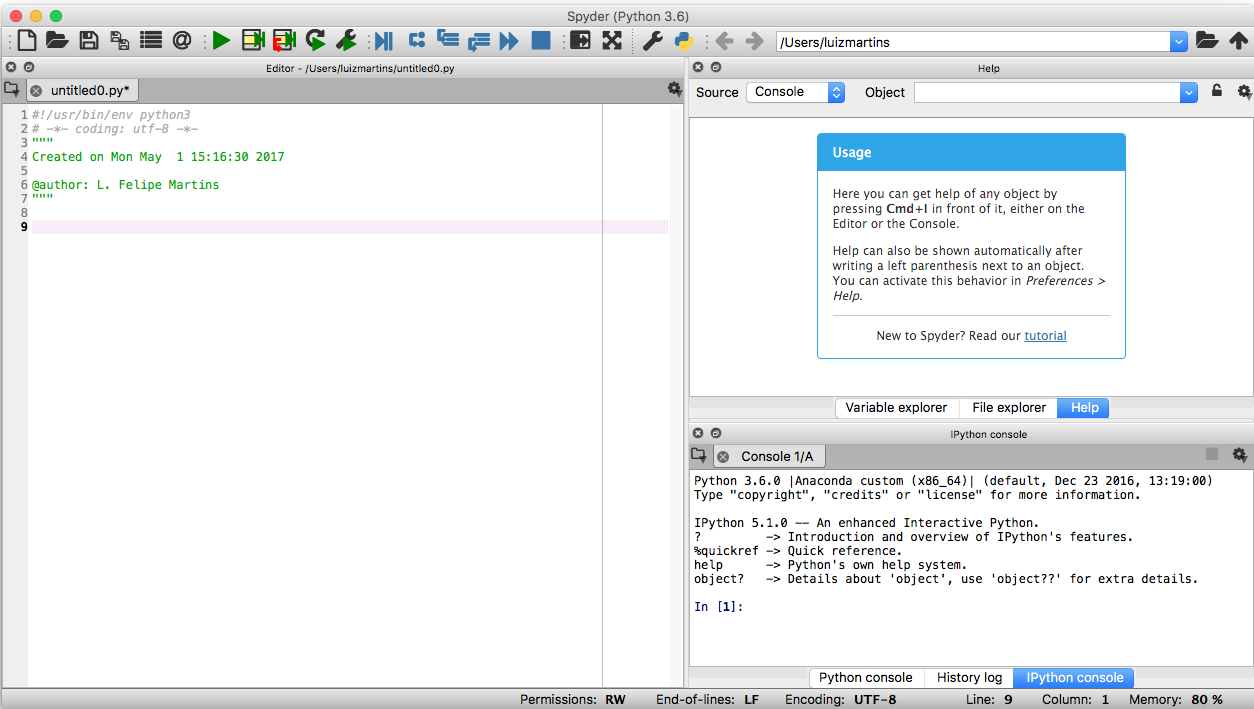
The window shown contains the following panes:
- On the left side of the window is the the Editor pane, where you enter code.
- The top right pane is the inspector pane. This pane is used to display information about code objects.
- The bottom right pane is the console pane. Notice that you can choose between an IPython console, a plain Python console, and the History Log.
To test the running code in Spyder, remove all text from the Editor window and type in the following code:
import numpy as np
import matplotlib.pyplot as plt
from scipy.special import eval_chebyt

fig = plt.figure()
xvalues = np.linspace(-1, 1, 300)
nmax = 5
for n in range(nmax+1):
   yvalues = eval_chebyt(n, xvalues)
   plt.plot(xvalues, yvalues)
plt.title('Chebyshev polynomials $T_n(x)$ for $n=0,\\ldots,{}$'.format(nmax))
plt.axhline(0, color='gray')
plt.axvline(0, color='gray')
plt.xlabel('$x$')
plt.ylabel('$T_n(x)$')

print('Displaying graph')
plt.show()
This code first imports NumPy, pyplot, and the special eval_chebyt function, which computes the values of Chebyshev polynomials of the first kind. Chebyshev polynomials are a family of orthogonal polynomials that are important in the design of some numerical methods. Then, the code defines a figure object, stored in the variable fig. Then it computes arrays containing values of the first six Chebyshev polynomials and plots them in the figure, which is then displayed after the formatting of the title and labels on the graph.
To run the code, go to the Spyder menu and select Run-Configure. The following window with configuration options will pop up on the screen:
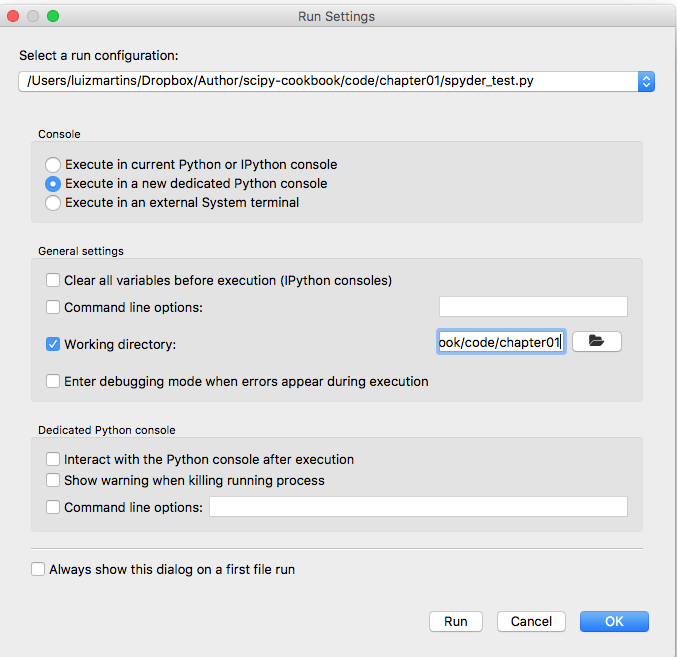
In the Console section, choose Execute in a new dedicated Python console, and leave all other options with their default values. Click OK to dismiss the box. Now, back in the main Spyder window, choose Run-Run on the menu, or press F5. The script will be launched and, after a few seconds, a window with a plot of the Chebyshev polynomials will be displayed. Closing the graph window will continue the execution of the script.
Spyder is a powerful yet simple to use IDE. To explore the features of Spyder, the reader is encouraged to explore the software's official documentation: https://pythonhosted.org/spyder/.