Book Image

Redash v5 Quick Start Guide

By : Alexander Leibzon, Yael Leibzon
Book Image

Redash v5 Quick Start Guide

By: Alexander Leibzon, Yael Leibzon

Overview of this book

Data exploration and visualization is vital to Business Intelligence, the backbone of almost every enterprise or organization. Redash is a querying and visualization tool developed to simplify how marketing and business development departments are exposed to data. If you want to learn to create interactive dashboards with Redash, explore different visualizations, and share the insights with your peers, then this is the ideal book for you. The book starts with essential Business Intelligence concepts that are at the heart of data visualizations. You will learn how to find your way round Redash and its rich array of data visualization options for building interactive dashboards. You will learn how to create data storytelling and share these with peers. You will see how to connect to different data sources to process complex data, and then visualize this data to reveal valuable insights. By the end of this book, you will be confident with the Redash dashboarding tool to provide insight and communicate data storytelling.
Table of Contents (10 chapters)

The benefits of visualizations

Nowadays, people (and not necessarily analysts, or statisticians) get exposed to lots of data, whether it's business data (such as acquisitions, campaign revenue, or payments) or sensor data (such as average temperature, humidity, and barometric pressure).

In addition to the fact that the amount of data can be large, the data can contain noise, which obscures your insight. In most cases, the data comes unnormalized and has no proper reference points, which makes it harder to gain an insight into, especially for inexperienced analysts, or people who don't come from a statistical background.

These are the places where visualizing data comes in handy.

Consider the following example of daily active users (number of active users per day), as seen in the following table:

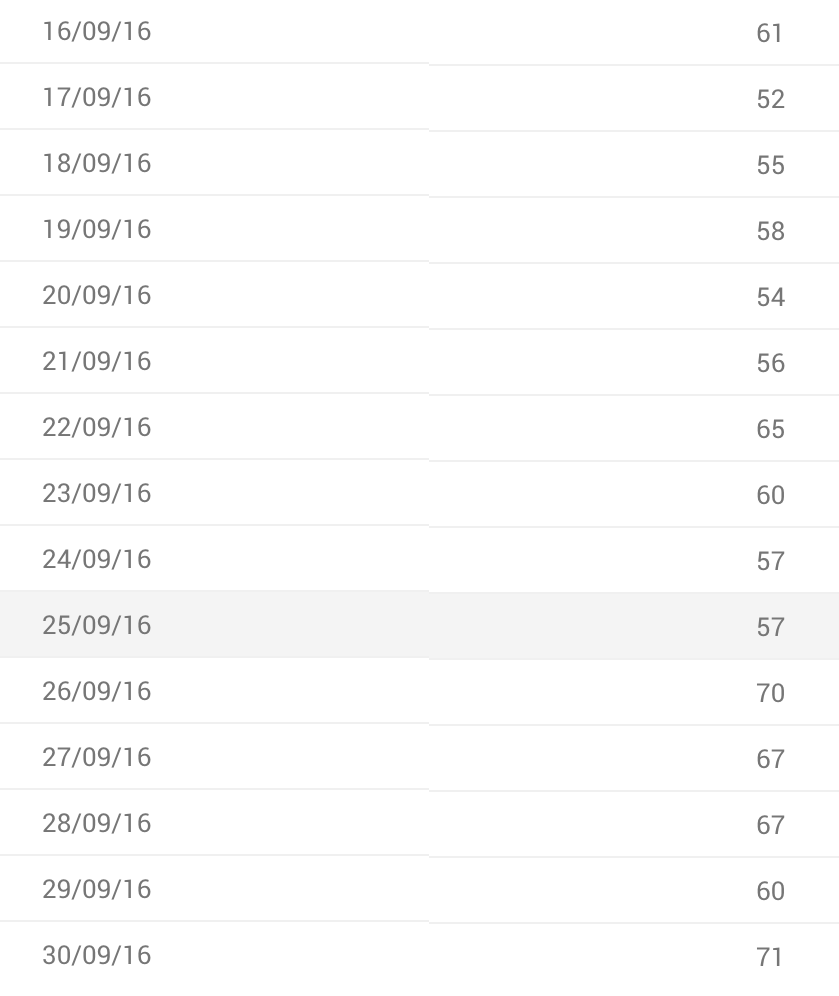
And in the following chart (the green arrows and red trend lines are drawn...