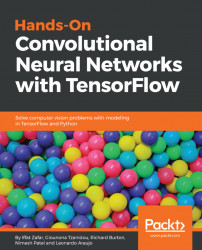

In the following illustration, we can see the main difference between generative models and discriminative models. With discriminative models, we generally try to find ways of separating or "discriminating" between different classes in our data. However, with generative models, we try to find out the probability distribution of our data. In the illustration, the distributions are represented by the large blue and yellow blobs that contain smaller circles. If we learn this distribution from our data, we will be able to sample or "generate" new data points that should belong to it like the red triangle.

Trying to capture the probability distribution of a dataset has the following use cases:
- Pretrain a model with unlabeled data
- Augment your dataset (in theory, if you capture the probability distribution of your data, you can generate more data)
- Compress your data (lossy)
- Create some sort of simulator (for example, a quadcopter can be controlled with four inputs; if you capture...