
As an example, if we know that our friend, Mary, feels cold when it is 10°C, but warm when it is 25°C, then in a room where it is 22°C, the nearest neighbor algorithm would guess that our friend would feel warm, because 22 is closer to 25 than to 10.
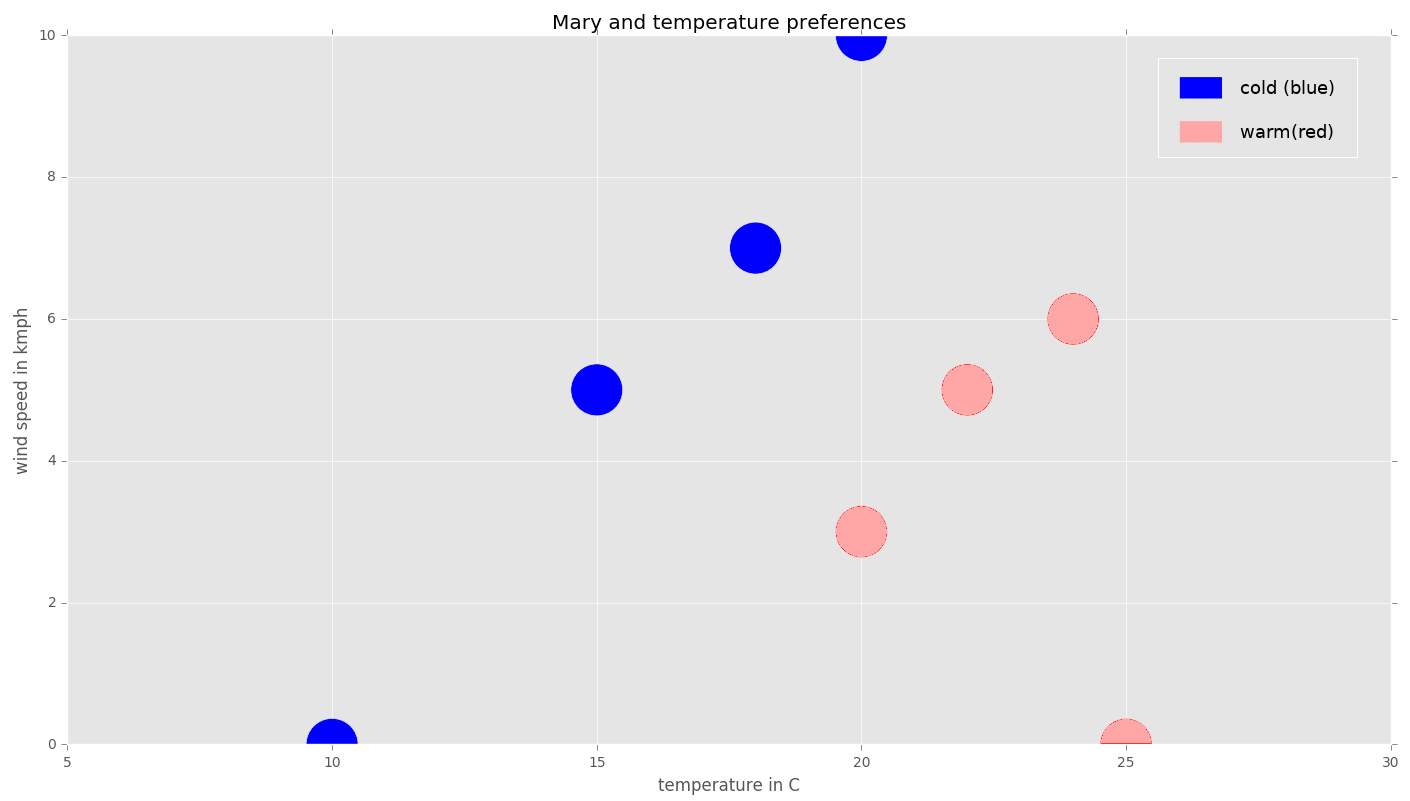
Suppose that we would like to know when Mary feels warm and when she feels cold, as in the previous example, but in addition, wind speed data is also available when Mary is asked whether she feels warm or cold:
Temperature in °C | Wind speed in km/h | Mary's perception |
10 | 0 | Cold |
25 | 0 | Warm |
15 | 5 | Cold |
20 | 3 | Warm |
18 | 7 | Cold |
20 | 10 | Cold |
22 | 5 | Warm |
24 | 6 | Warm |
We could represent the data in a graph, as follows:
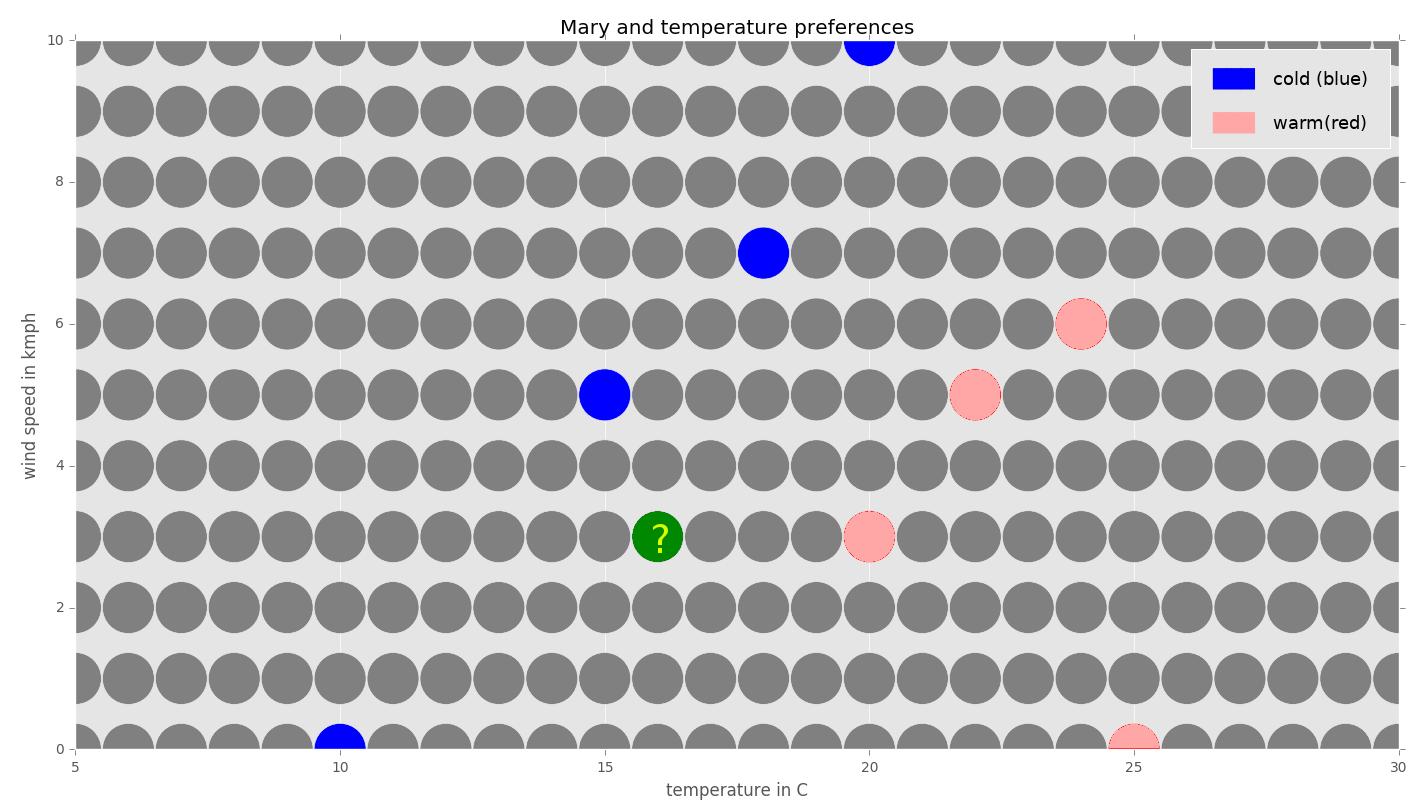
Now, suppose we would like to find out how Mary feels when the temperature is 16°C with a wind speed of 3 km/h by using the 1-NN algorithm:
For simplicity, we will use a Manhattan metric to measure the distance between the neighbors on the grid. The Manhattan distance dMan of the neighbor N1=(x1,y1) from the neighbor N2=(x2,y2) is defined as dMan=|x1-x2|+|y1-y2|.
Let's label the grid with distances around the neighbors to see which neighbor with a known class is closest to the point we would like to classify:
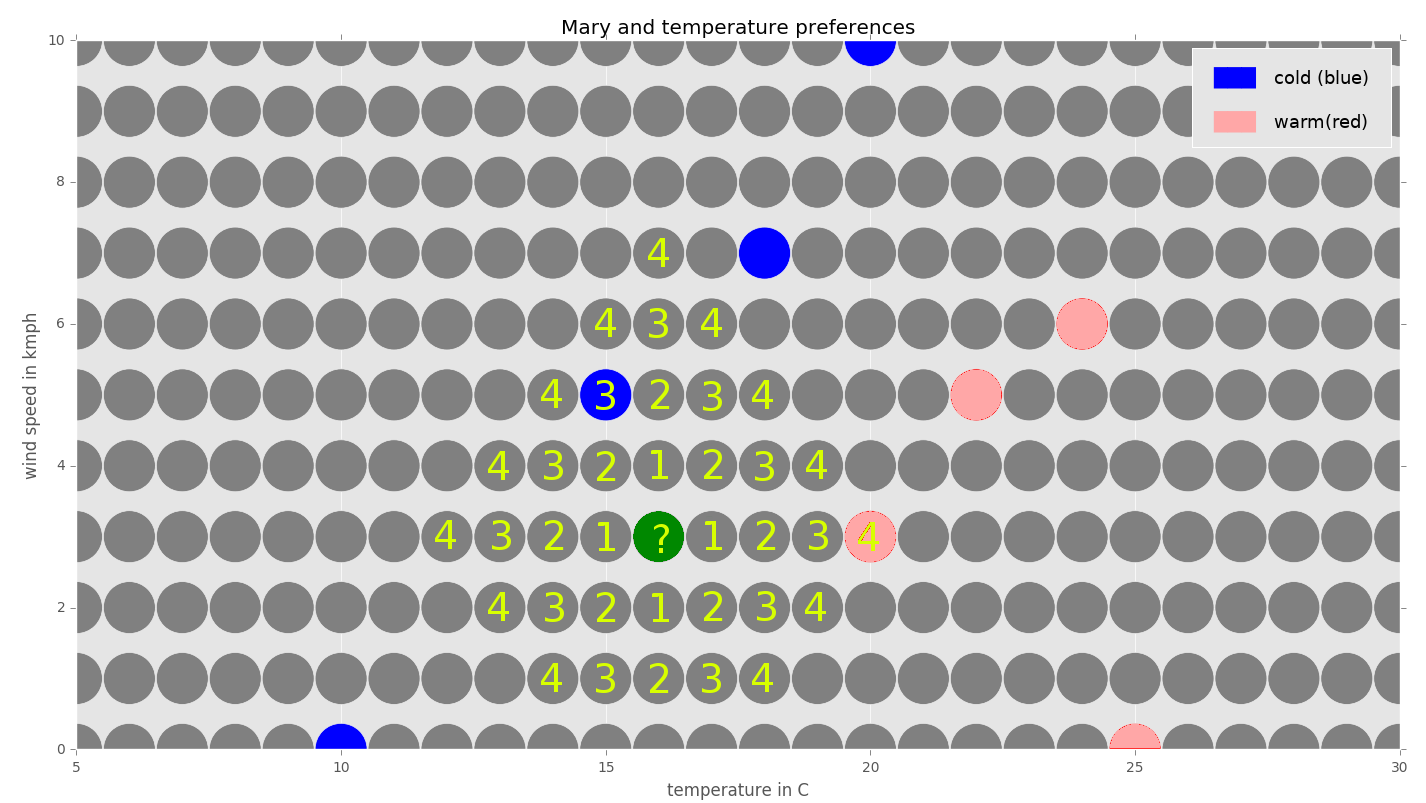
We can see that the closest neighbor with a known class is the one with a temperature of 15°C (blue) and a wind speed of 5 km/h. Its distance from the point in question is three units. Its class is blue (cold). The closest red (warm) neighbour is at a distance of four units from the point in question. Since we are using the 1-nearest neighbor algorithm, we just look at the closest neighbor and, therefore, the class of the point in question should be blue (cold).
By applying this procedure to every data point, we can complete the graph, as follows:
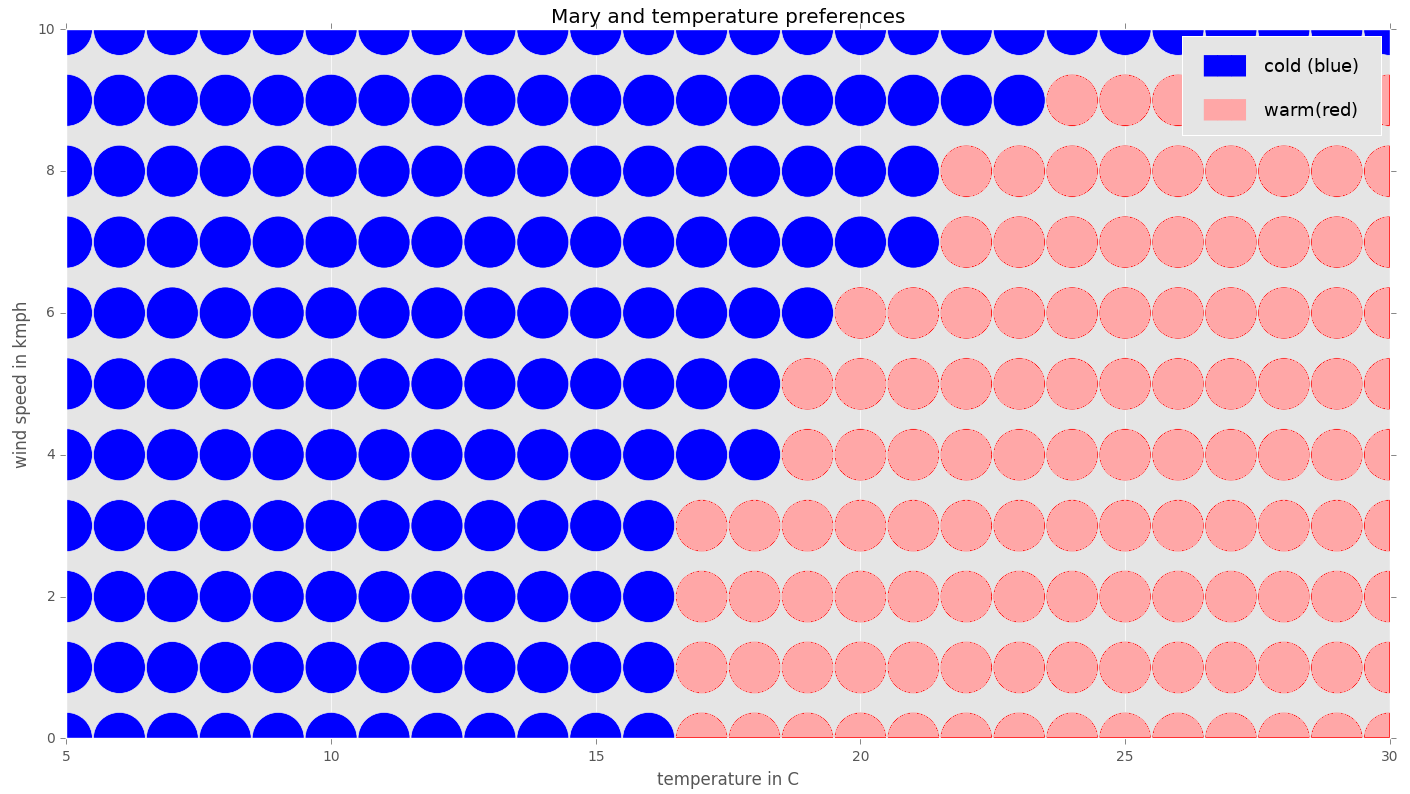
Note that, sometimes, a data point might be the same distance away from two known classes: for example, 20°C and 6 km/h. In such situations, we could prefer one class over the other, or ignore these boundary cases. The actual result depends on the specific implementation of an algorithm.