

Being able to find groups of similar data that exist in your dataset can be extremely valuable if you are trying to find its underlying meaning. If you were a store owner and you wanted to understand which customers are more valuable without a set idea of what valuable is, clustering would be a great place to start to find patterns in your data. You may have a few high-level ideas of what denotes a valuable customer, but you aren't entirely sure in the face of a large mountain of available data. Through clustering you can find commonalities among similar groups in your data. If you look more deeply at a cluster of similar people, you may learn that everyone in that group visits your website for longer periods of time than others. This can show you what the value is and also provides a clean sample size for future supervised learning experiments.
The following figure shows two scatterplots:
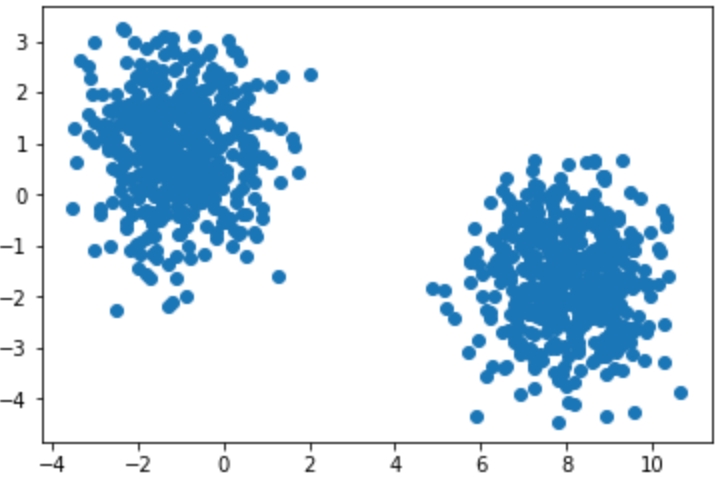
Figures 1.2: Two distinct scatterplots
The following figure separates the scatterplots into two distinct clusters:
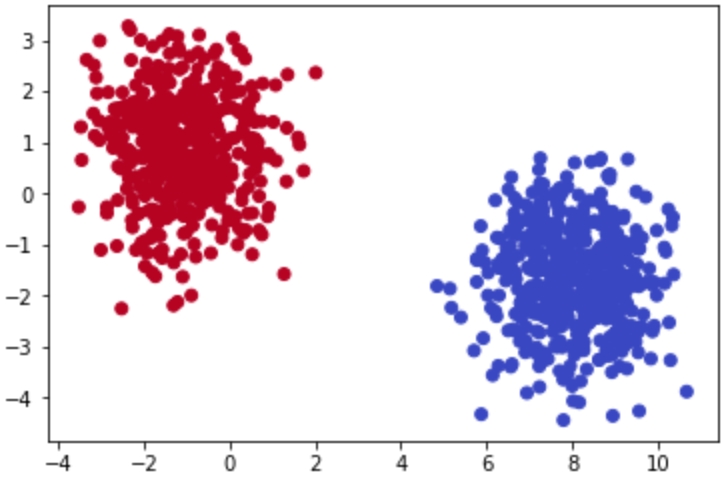
Figure 1.3: Scatterplots clearly showing clusters that exist in a provided dataset
Both figures display randomly generated number pairs (x,y coordinates) pulled from a Gaussian distribution. Simply by glancing at Figure 1.2, it should be plainly obvious where the clusters exist in your data – in real life, it will never be this easy. Now that you know that the data can be clearly separated into two clusters, you can start to understand what differences exist between the two groups.
Rewinding a bit from where unsupervised learning fits into the larger machine learning environment, let's begin by understanding the building blocks of clustering. The most basic definition finds clusters simply as groupings of similar data as subsets of a larger dataset. As an example, imagine that you had a room with 10 people in it and each person had a job either in finance or as a scientist. If you told all of the financial workers to stand together and all the scientists to do the same, you would have effectively formed two clusters based on job types. Finding clusters can be immensely valuable in identifying items that are more similar, and, on the other end of the scale, quite different from each other.
To understand this, imagine that you were given a simple 1,000-row dataset by your employer that had two columns of numerical data as follows:
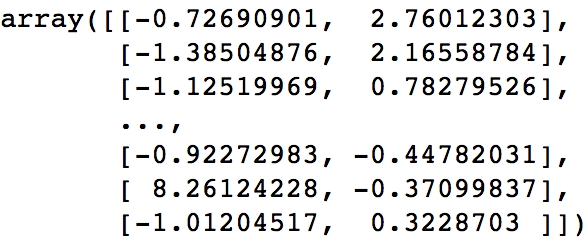
Figures 1.4: Two-dimensional raw data in a NumPy array
At first glance, this dataset provides no real structure or understanding – confusing to say the least!
A dimension in a dataset is another way of simply counting the number of features available. In most organized data tables, you can view the number of features as the number of columns. So, using the 1,000-row dataset example of size (1,000 x 2), you will have 1,000 observations across two dimensions:
You begin by plotting the first column against the second column to get a better idea of what the data structure looks like. There will be plenty of times where the cause of differences between groups will prove to be underwhelming, however the cases that have differences that you can take action on are extremely rewarding!
You are given two-dimensional plots. Please look at the provided two-dimensional graphs and identify the clusters, to drive the point home that machine learning is important. Without using any algorithmic approaches, identify where the clusters exist in the data.
This exercise will help start to build your intuition of how we identify clusters using our own eyes and thought processes. As you complete the exercises, think of the rationale of why a group of data points should be considered a cluster versus a group that should not be considered a cluster:
Identify the clusters in the following scatterplot:
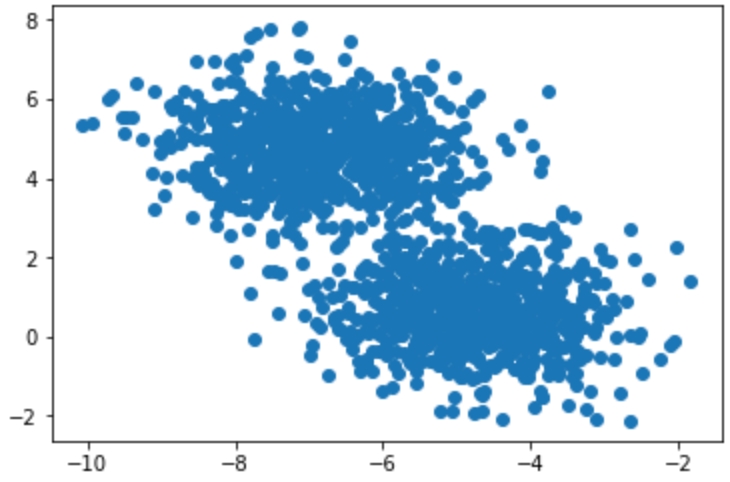
Figure1.5 Two-dimensional scatterplot
The clusters are as follows:
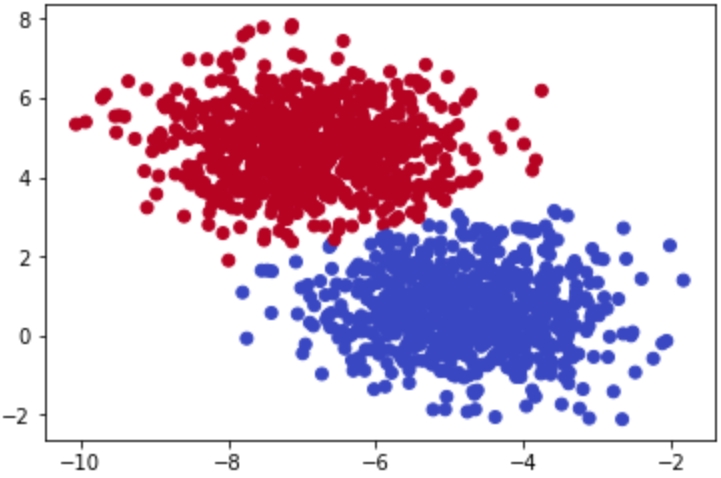
Figure 1.6: Clusters in the scatterplot
Identify the clusters in the scatterplot:
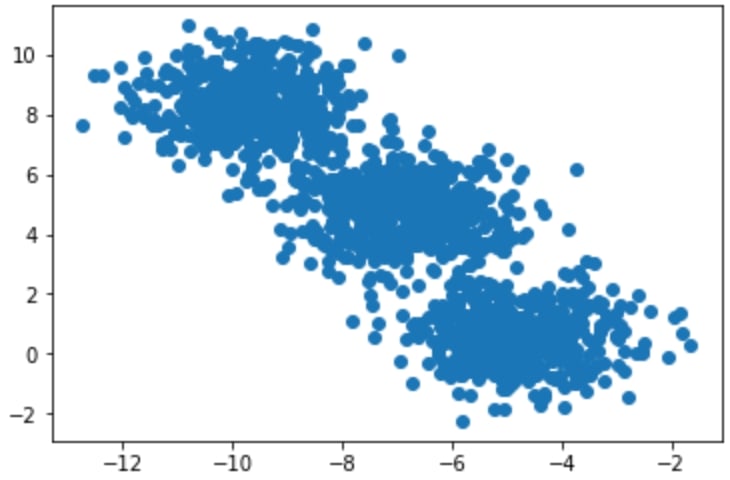
Figure1.7: Two-dimensional scatterplot
The clusters are as follows:
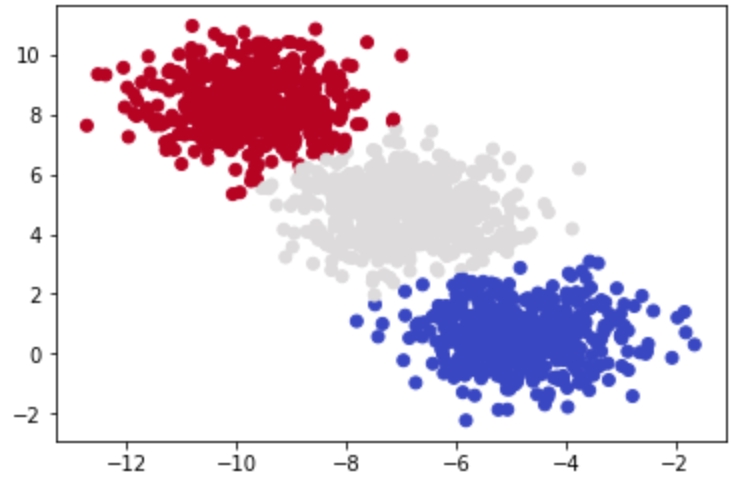
Figure 1.8: Clusters in the scatterplot
Identify the clusters in the scatterplot:
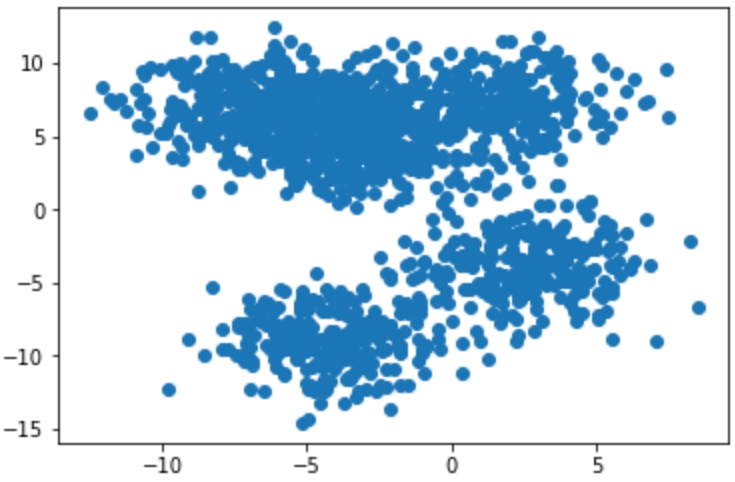
Figure1.9: Two-dimensional scatterplot
The clusters are as follows:
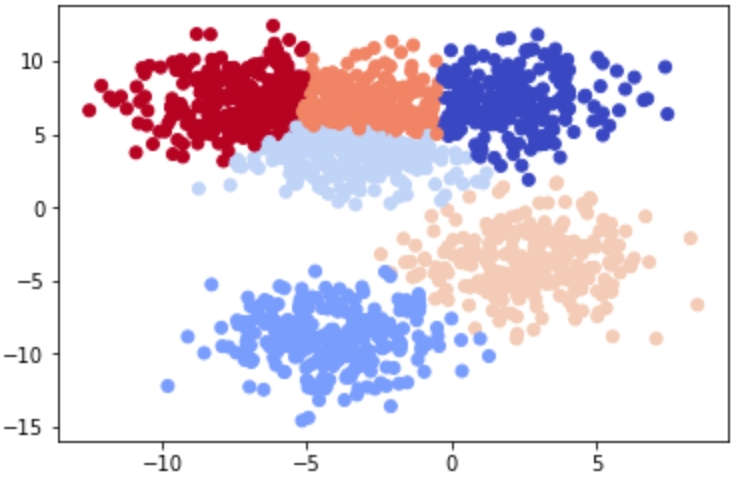
Figure 1.10: Clusters in the scatterplot
Most of these examples were likely quite easy for you to understand – and that's the point! The human brain and eyes are incredible at finding patterns in the real world. Within milliseconds of viewing each plot, you could tell what fitted together and what didn't. While it is easy for you, a computer does not have the ability to see and process plots in the same manner that we do. However, this is not always a bad thing – look back at Figure 1.10. Were you able to find the six discrete clusters in the data just by looking at the plot? You probably found only three to four clusters in this figure, while a computer is able to see all six. The human brain is magnificent, but it also lacks the nuances that come within a strictly logic-based approach. Through algorithmic clustering, you will learn how to build a model that works even better than a human at these tasks!
Let's look at the algorithm in the next section.