

There are many ways in which you may have learned to develop with QlikView. Some of them may have talked about performance and some may not have. Typically, you start to think about performance at a later stage when users start complaining about slow results from a QlikView application or when your QlikView server is regularly crashing because your applications are too big.
In this section, we are going to quickly review some basic performance tuning techniques that you should, hopefully, already be aware of. Then, we will start looking at how we can advance your knowledge to master level.
Removing unneeded data might seem easy in theory, but sometimes it is not so easy to implement—especially when you need to negotiate with the business. However, the quickest way to improve the performance of a QlikView application is to remove data from it. If you can reduce your number of fact rows by half, you will vastly improve performance. The different options are discussed in the next sections.
The first option is to simply reduce the number of rows. Here we are interested in Fact or Transaction table rows—the largest tables in your data model. Reducing the number of dimension table rows rarely produces a significant performance improvement.
The easiest way to reduce the number of these rows is usually to limit the table by a value such as the date. It is always valuable to ask the question, "Do we really need all the transactions for the last 10 years?" If you can reduce this, say to 2 years, then the performance will improve significantly.
We can also choose to rethink the grain of the data—to what level of detail we hold the information. By aggregating the data to a higher level, we will often vastly reduce the number of rows.
The second option is to reduce the width of tables—again, especially Fact or Transaction tables. This means looking at fields that might be in your data model but do not actually get used in the application. One excellent way of establishing this is to use the Document Analyzer tool by Rob Wunderlich to examine your application (http://robwunderlich.com/downloads).
As well as other excellent uses, Rob's tool looks at multiple areas of an application to establish whether fields are being used or not. It will give you an option to view fields that are not in use and has a useful DROP FIELD Statements listbox from which you can copy the possible values. The following screenshot shows an example (from the default document downloadable from Rob's website):
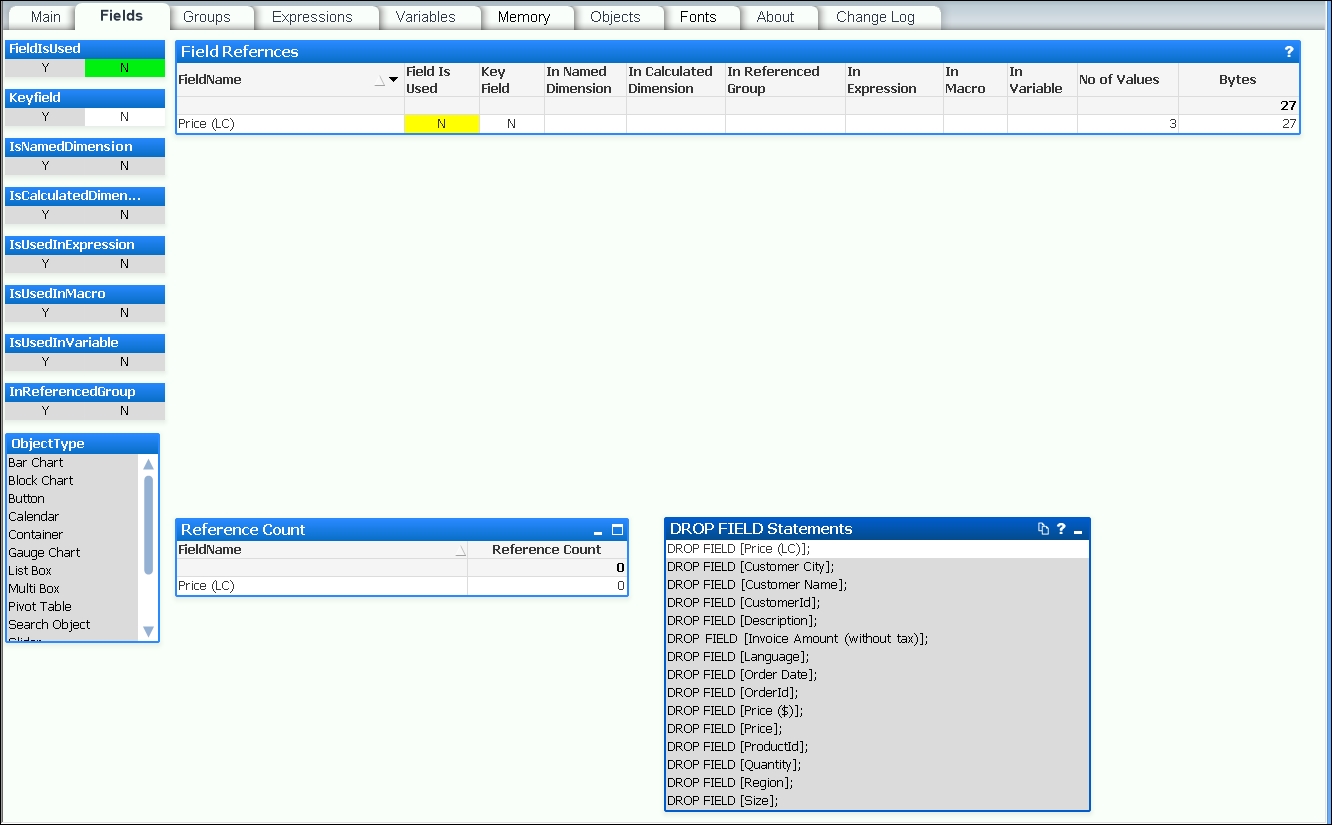
Adding these DROP FIELD statements into the end of a script makes it very easy to remove fields from your data model without having to dive into the middle of the script and try to remove them during the load—which could be painful.
There is a potential issue here; if you have users using collaboration objects—creating their own charts—then this tool will not detect that usage. However, if you use the DROP FIELD option, then it is straightforward to add a field back if a user complains that one of their charts is not working.
Of course, the best practice would be to take the pain and remove the fields from the script by either commenting them out or removing them completely from their load statements. This is more work, because you may break things and have to do additional debugging, but it will result in a better performing script.
Often, you will have a text value in a key field, for example, something like an account number that has alphanumeric characters. These are actually quite poor for performance compared to an integer value and should be replaced with numeric keys.
Note
There is some debate here about whether this makes a difference at all, but the effect is to do with the way the data is stored under the hood, which we will explore later. Generated numeric keys are stored slightly differently than text keys, which makes things work better.
The strategy is to leave the text value (account number) in the dimension table for use in display (if you need it!) and then use the AutoNumber function to generate a numeric value—also called a surrogate key—to associate the two tables.
For example, replace the following:
Account:
Load
   AccountId,
   AccountName,
   …
From Account.qvd (QVD);

Transaction:
Load
   TransactionId,
   AccountId,
   TransactionDate,
   …
From Transaction.qvd (QVD);
With the following:
Account:
Load
   AccountId,
   AutoNumber(AccountId) As Join_Account,
   AccountName,
   …
From Account.qvd (QVD);

Transaction:
Load
   TransactionId,
   AutoNumber(AccountId) As Join_Account,
   TransactionDate,
   …
From Transaction.qvd (QVD);
The AccountId field still exists in the Account table for display purposes, but the association is on the new numeric field, Join_Account.
We will see later that there is some more subtlety to this that we need to be aware of.
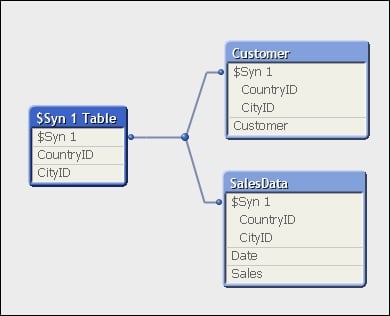
A synthetic key, caused when tables are associated on two or more fields, actually results in a whole new data table of keys within the QlikView data model.
The following screenshot shows an example of a synthetic key using Internal Table View within Table Viewer in QlikView:
In general, it is recommended to remove synthetic keys from your data model by generating your own keys (for example, using AutoNumber):
Load
   AutoNumber(CountryID & '-' & CityID) As ClientID,
   Date,
   Sales
From Fact.qvd (qvd);
The following screenshot shows the same model with the synthetic key resolved using the AutoNumber method:
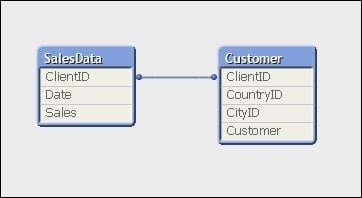
This removes additional data in the data tables (we'll cover more on this later in the chapter) and reduces the number of tables that queries have to traverse.