

When we build an analytics pipeline, the first thing that we need to do is to build a data model. A data model is an overview of the data sources that we will be using, their relationships with other data sources, where exactly the data from a specific source is going to enter the pipeline, and in what form (such as an Excel file, a database, or a JSON from an internet source). The data model for the pipeline evolves over time as data sources and processes change. A data model can contain data of the following three types:
Structured Data: This is also known as completely structured or well-structured data. This is the simplest way to manage information. The data is arranged in a flat tabular form with the correct value corresponding to the correct attribute. There is a unique column, known as an index, for easy and quick access to the data, and there are no duplicate columns. Data can be queried exactly through SQL queries, for example, data in relational databases, MySQL, Amazon Redshift, and so on.
Semi-structured data: This refers to data that may be of variable lengths and that may contain different data types (such as numerical or categorical) in the same column. Such data may be arranged in a nested or hierarchical tabular structure, but it still follows a fixed schema. There are no duplicate columns (attributes), but there may be duplicate rows (observations). Also, each row might not contain values for every attribute, that is, there may be missing values. Semi-structured data can be stored accurately in NoSQL databases, Apache Parquet files, JSON files, and so on.
Unstructured data: Data that is unstructured may not be tabular, and even if it is tabular, the number of attributes or columns per observation may be completely arbitrary. The same data could be represented in different ways, and the attributes might not match each other, with values leaking into other parts. Unstructured data can be stored as text files, CSV files, Excel files, images, audio clips, and so on.
Marketing data, traditionally, comprises data of all three types. Initially, most data points originated from different (possibly manual) data sources, so the values for a field could be of different lengths, the value for one field would not match that of other fields because of different field names, some rows containing data from even the same sources could also have missing values for some of the fields, and so on. But now, because of digitization, structured and semi-structured data is also available and is increasingly being used to perform analytics. The following figure illustrates the data model of traditional marketing analytics comprising all kinds of data: structured data such as databases (top), semi-structured data such as JSONs (middle), and unstructured data such as Excel files (bottom):
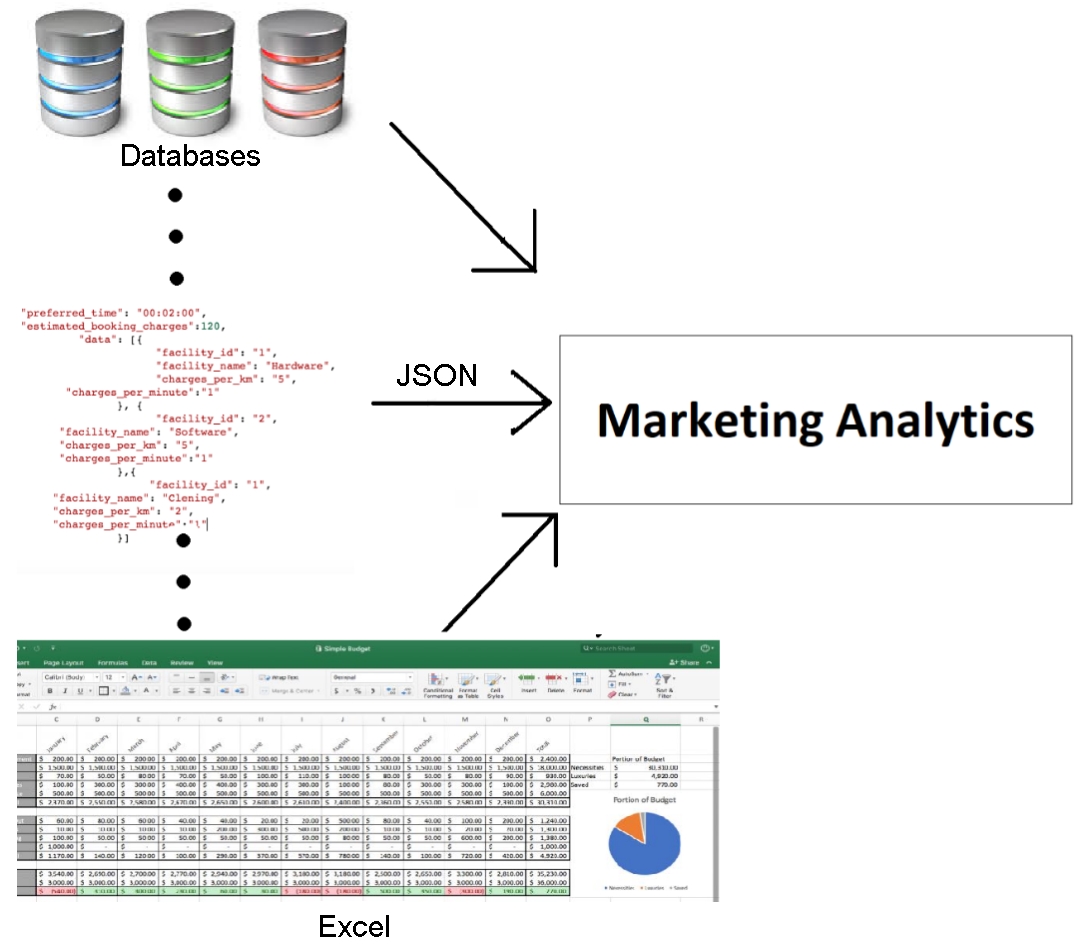
Figure 1.1: Data model of traditional marketing analytics
A data model with all these different kinds of data is prone to errors and is very risky to use. If we somehow get a garbage value into one of the attributes, our entire analysis will go awry. Most of the times, the data we need is of a certain kind and if we don't get that type of data, we might run into a bug or problem that would need to be investigated. Therefore, if we can enforce some checks to ensure that the data being passed to our model is almost always of the same kind, we can easily improve the quality of data from unstructured to at least semi-structured.
This is where programming languages such as Python come into play. Python is an all-purpose general programming language that not only makes writing structure-enforcing scripts easy, but also integrates with almost every platform and automates data production, analysis, and analytics into a more reliable and predictable pipeline. Apart from understanding patterns and giving at least a basic structure to data, Python forces intelligent pipelines to accept the right value for the right attribute. The majority of analytics pipelines are exactly of this kind. The following figure illustrates how most marketing analytics today structure different kinds of data by passing it through scripts to make it at least semi-structured:
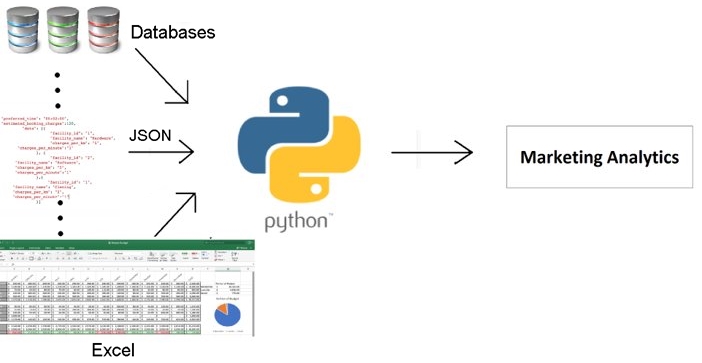
Figure 1.2: Data model of most marketing analytics that use Python
By making use of such structure-enforcing scripts, we will have a pipeline of semi-structured data coming in with expected values in the right fields; however, the data is not yet in the best possible format to perform analytics. If we can completely structure our data (that is, arrange it in flat tables, with the right value pointing to the right attribute with no nesting or hierarchy), it will be easy for us to see how every data point individually compares to other points being considered in the common fields, and would also make the pipeline scalable. We can easily get a feel of the data—that is, see in what range most values lie, identify the clear outliers, and so on—by simply scrolling through the data.
While there are a lot of tools that can be used to convert data from an unstructured/semi-structured format to a fully structured format (for example, Spark, STATA, and SAS), the tool that is most commonly used for data science, can be integrated with practically any framework, has rich functionalities, minimal costs, and is easy-to-use for our use case, is pandas. The following figure illustrates how a data model structures different kinds of data from being possibly unstructured to semi-structured (using Python), to completely structured (using pandas):
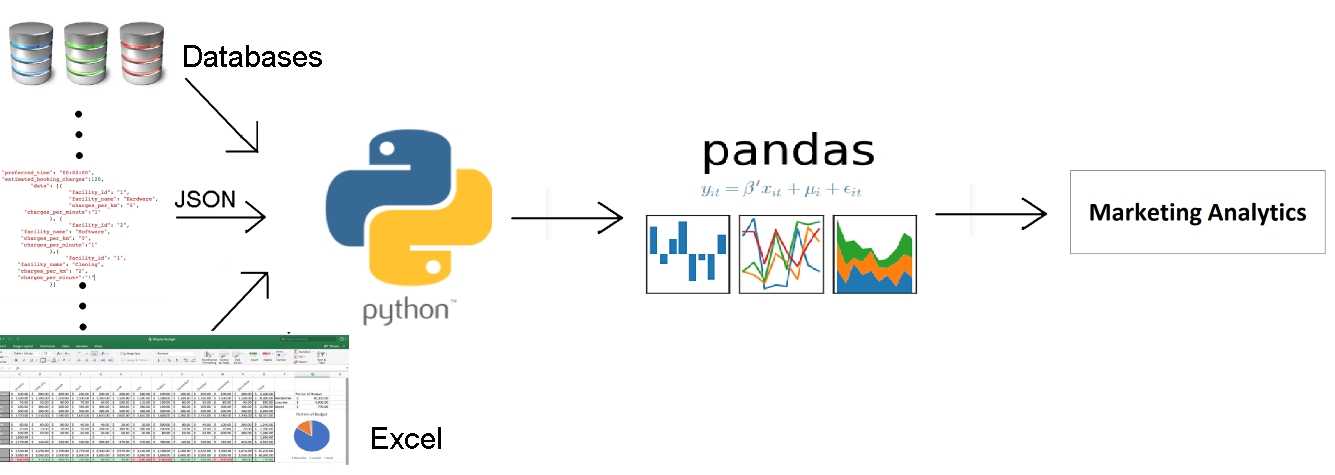
Figure 1.3: Data model to structure the different kinds of data