

NumPy is not required to use matplotlib. However, many matplotlib tricks, code samples, and examples use NumPy. A short introduction to NumPy usage will show you the reason.
Along with having Python and matplotlib installed, you also have NumPy installed. You have a text editor and a command terminal.
Let's plot another curve, sin(x), with x in the [0, 2 * pi] interval. The only difference with the preceding script is the part where we generate the point coordinates. Type and save the following script as sin-1.py:
import math
import matplotlib.pyplot as plt

T = range(100)
X = [(2 * math.pi * t) / len(T) for t in T]
Y = [math.sin(value) for value in X]

plt.plot(X, Y)
plt.show()
Then, type and save the following script as sin-2.py:
import numpy as np
import matplotlib.pyplot as plt
X = np.linspace(0, 2 * np.pi, 100)
Y = np.sin(X)

plt.plot(X, Y)
plt.show()
Running either sin-1.py or sin-2.py will show the following graph exactly:
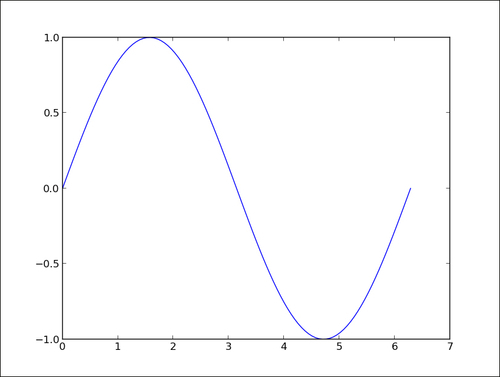
The first script, sin-1.py, generates the coordinates for a sinusoid using only Python's standard library. The following points describe the steps we performed in the script in the previous section:
We created a list
Twith numbers from 0 to 99—our curve will be drawn with 100 points.We computed the x coordinates by simply rescaling the values stored in
Tso that x goes from 0 to 2 pi (therange()built-in function can only generate integer values).As in the first example, we generated the y coordinates.
The second script sin-2.py, does exactly the same job as sin-1.py—the results are identical. However, sin-2.py is slightly shorter and easier to read since it uses the NumPy package.
Tip
NumPy is a Python package for scientific computing. matplotlib can work without NumPy, but using NumPy will save you lots of time and effort. The NumPy package provides a powerful multidimensional array object and a host of functions to manipulate it.
The NumPy package
In sin-2.py, the X list is now a one-dimensional NumPy array with 100 evenly spaced values between 0 and 2 pi. This is the purpose of the function numpy.linspace. This is arguably more convenient than computing as we did in sin-1.py. The Y list is also a one-dimensional NumPy array whose values are computed from the coordinates of X. NumPy functions work on whole arrays as they would work on a single value. Again, there is no need to compute those values explicitly one-by-one, as we did in sin-1.py. We have a shorter yet readable code compared to the pure Python version.
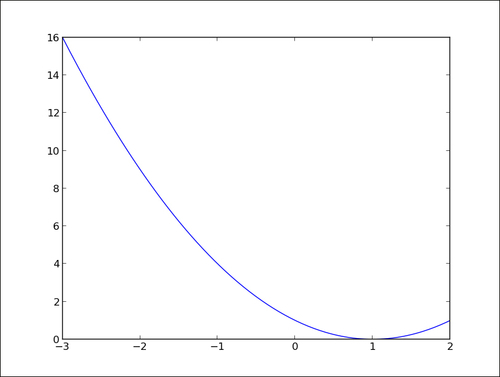
NumPy can perform operations on whole arrays at once, saving us much work when generating curve coordinates. Moreover, using NumPy will most likely lead to much faster code than the pure Python equivalent. Easier to read and faster code, what's not to like? The following is an example where we plot the binomial x^2 -2x +1 in the [-3,2] interval using 200 points:
import numpy as np
import matplotlib.pyplot as plt

X = np.linspace(-3, 2, 200)
Y = X ** 2 - 2 * X + 1.

plt.plot(X, Y)
plt.show()
Running the preceding script will give us the result shown in the following graph:
Again, we could have done the plotting in pure Python, but it would arguably not be as easy to read. Although matplotlib can be used without NumPy, the two make for a powerful combination.