

A simple but useful trick is to display two bar charts back-to-back at the same time. Think of an age pyramid of a population, showing the number of people within different age ranges. On the left side, we show the male population, while on the right we show the female population.
The idea is to have two bar charts, using a simple trick, that is, the length/height of one bar can be negative!
import numpy as np
import matplotlib.pyplot as plt

women_pop = np.array([5., 30., 45., 22.])
men_pop     = np.array( [5., 25., 50., 20.])
X = np.arange(4)

plt.barh(X, women_pop, color = 'r')
plt.barh(X, -men_pop, color = 'b')
plt.show()
The preceding script will produce the following graph:
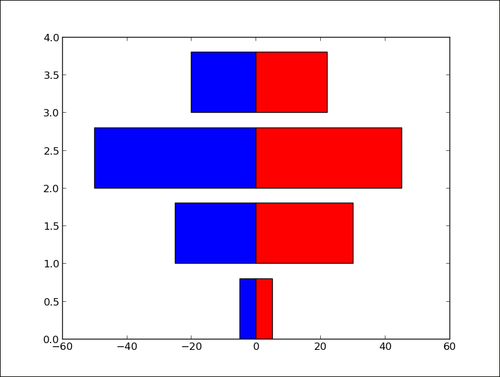
The bar chart for the female population (in red) is plotted as usual. However, the bar chart for the male population (in blue) has its bar extending to the left rather than the right. Indeed, the lengths of the bars for the blue bar chart are negative values. Rather than editing the input values, we use a list comprehension to negate values for the male population bar chart.