

So far, we have seen that 3D plots essentially mimic their 2D counterparts. However, there's more to matplotlib's three-dimensional plotting abilities. A lot of figures specific to the third dimension are also possible. Let's start with a simple use case: plotting a 2D scalar field as a 3D surface.
As usual, we are going to generate some test data, set up an Axes3D instance, and pass our data to it:
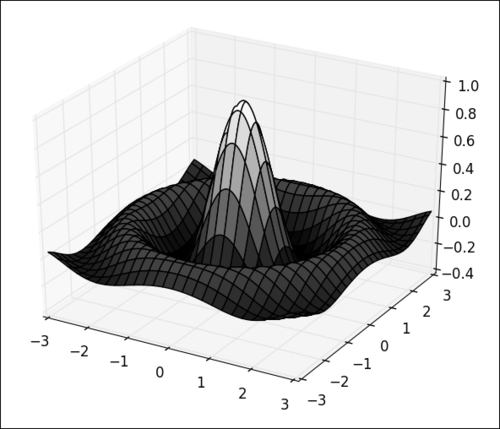
import numpy as np
from matplotlib import cm
from mpl_toolkits.mplot3d import Axes3D
import matplotlib.pyplot as plt

x = np.linspace(-3, 3, 256)
y = np.linspace(-3, 3, 256)
X, Y = np.meshgrid(x, y)
Z = np.sinc(np.sqrt(X ** 2 + Y ** 2))

fig = plt.figure()
ax = fig.gca(projection = '3d')
ax.plot_surface(X, Y, Z, cmap=cm.gray)
plt.show()
The preceding code will show the following figure:
The data generation works in exactly the same way as was demonstrated in Chapter 6, Working with Maps. Two matrices, X and Y, are created holding the coordinates...