Book Image

gnuplot Cookbook

By : Lee Phillips
Book Image

gnuplot Cookbook

By: Lee Phillips

Overview of this book

gnuplot is the world's finest technical plotting software, used by scientists, engineers, and others for many years. It is in constant development and runs on practically every operating system, and can produce output in almost any format. The quality of its 3d plots is unmatched and its ability to be incorporated into computer programs and document preparation systems is excellent. gnuplot Cookbook ñ it will help you master gnuplot. Start using gnuplot immediately to solve your problems in data analysis and presentation. Quickly find a visual example of the graph you want to make and see a complete, working script for producing it. Learn how to use the new features in gnuplot 4.4. Find clearly explained, working examples of using gnuplot with LaTeX and with your own computer programming language. You will master all the ins and outs of gnuplot through gnuplot Cookbook. You will learn to plot basic 2d to complex 3d plots, annotate from simple labels to equations, integrate from simple scripts to full documents and computer progams. You will be taught to annotate graphs with equations and symbols that match the style of the rest of your text, thus creating a seamless, professional document. You will be guided to create a web page with an interactive graph, and add graphical output to your simulation or numerical analysis program. Start using all of gnuplot's simple to complex features to suit your needs, without studying its 200 page manual through this Cookbook.
Table of Contents (18 chapters)
gnuplot Cookbook
Credits
About the Author
About the Reviewers
www.PacktPub.com
Preface
Finding Help and Information
Index

Making a contour plot


A contour plot is a set of isolines, or curves where the function or data has a constant value, drawn in the plane of the independent variables (x and y in Cartesian coordinates). It is simpler than the surface plots covered in the previous recipes in that it doesn't require the interpretation of perspective or hidden line removal. As there is no z axis for reference, the value that each isoline represents is represented by an individual label or by giving each line its own dash pattern or color.

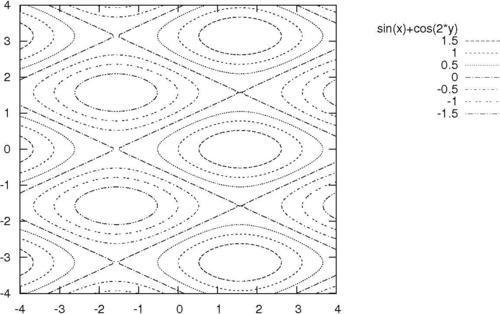
Certain types of patterns are better represented as surfaces, while for others, contours bring out more of the relevant characteristics. The rotationally invariant function that we plotted in the previous recipes in this chapter would yield a set of uninteresting circular contours; its structure is better conveyed by a surface plot. Here, we've plotted a function whose contour plot shows a pattern of nodal lines.

How to do it…

The following code sample will get you a contour...