Book Image

NumPy Cookbook

Book Image

NumPy Cookbook

Overview of this book

Today's world of science and technology is all about speed and flexibility. When it comes to scientific computing, NumPy is on the top of the list. NumPy will give you both speed and high productivity. "NumPy Cookbook" will teach you all about NumPy, a leading scientific computing library. NumPy replaces a lot of the functionality of Matlab and Mathematica, but in contrast to those products, it is free and open source. "Numpy Cookbook" will teach you to write readable, efficient, and fast code that is as close to the language of Mathematics as much as possible with the cutting edge open source NumPy software library. You will learn about installing and using NumPy and related concepts. At the end of the book, we will explore related scientific computing projects. This book will give you a solid foundation in NumPy arrays and universal functions. You will also learn about plotting with Matplotlib and the related SciPy project through examples. "NumPy Cookbook" will help you to be productive with NumPy and write clean and fast code.
Table of Contents (17 chapters)
NumPy Cookbook
Credits
About the Author
About the Reviewers
www.PacktPub.com
Preface
Index

Fancy indexing


In this tutorial, we will apply fancy indexing to set the diagonal values of the Lena image to 0. This will draw black lines along the diagonals, crossing it through, not because there is something wrong with the image, but just as an exercise. Fancy indexing is indexing that does not involve integers or slices, which is normal indexing.

How to do it...

We will start with the first diagonal:

  1. Set the values of the first diagonal to 0.

    To set the diagonal values to 0, we need to define two different ranges for the x and y values:

    lena[range(xmax), range(ymax)] = 0
  2. Set the values of the other diagonal to 0.

    To set the values of the other diagonal, we require a different set of ranges, but the principles stay the same:

    lena[range(xmax-1,-1,-1), range(ymax)] = 0

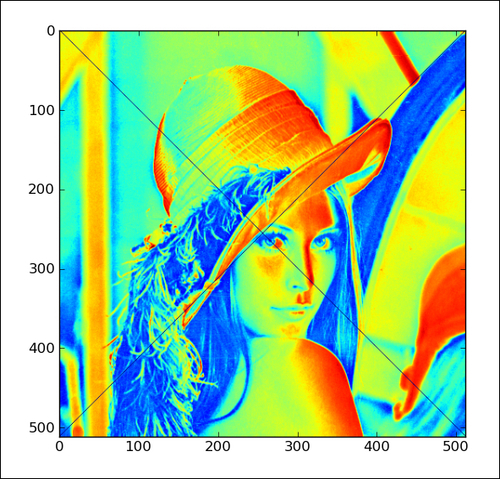
At the end, we get this image with the diagonals crossed off, as shown in the following screenshot:

The following is the complete code for this recipe:

import scipy.misc
import matplotlib.pyplot

# This script demonstrates fancy...