Book Image

The Business Analyst's Guide to Oracle Hyperion Interactive Reporting 11

By : Edward Cody
Book Image

The Business Analyst's Guide to Oracle Hyperion Interactive Reporting 11

By: Edward Cody

Overview of this book

Oracle Hyperion Interactive Reporting is one of the many products in the Oracle Enterprise Performance Management software suite, an industry-leading business intelligence software package. The primary focus of the Interactive Reporting product is to provide strong relational querying and data analysis capabilities. It also provides the capability to disseminate information throughout an enterprise. There is a very steep learning curve for most users of this tool.This book examines the power of the Interactive Reporting Web Client software, focusing on the key features of each section of the product. The author's experience in developing and supporting Interactive Reporting users is very well documented in this book. The goal is to educate you on every useful feature of the product, enabling you to gather information from various sources and process it to produce meaningful results that help you to spot problems and analyze trends necessary for business decisions.The book starts with a quick introduction to the product interface and the EPM Workspace, with explanation of importing and provisioning. It then takes you through each section from building a query and data model to building graphical displays of the data in a logical sequence. The report sections and interactive dashboards are also discussed at length. The book also covers advanced features of the product and provides you with the information necessary to build the foundation for creating complex queries and computations using the product.
Table of Contents (16 chapters)
The Business Analyst's Guide to Oracle Hyperion Interactive Reporting 11
Credits
About the Author
Acknowledgement
About the Reviewer
Preface
Index

Adding content


Once a Pivot is added to the document, data from the parent Results or Table section may be added to the Pivot by adding elements to the Data Layout window in the section. The Data Layout section is displayed at the bottom of the main window and can be shown or hidden by clicking on the Data Layout button in the Section Title Bar. An example of the Data Layout window is shown in the following screenshot:

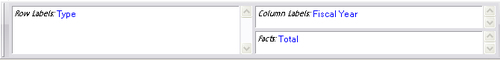
The Data Layout window contains three different areas controlling the display of content in the Pivot named Row Labels, Column Labels, and Facts. Items are added to the different areas by the following three methods:

Drag-and-drop method

Right-click method

Pivot menu method

Highlight the column(s) in the Elements window

Highlight and right-click the column(s) in the Elements window

Highlight the column(s) in the Elements Window

Left-click and drag the column(s) to the Row Labels, Column Labels, or Fact area in the Data Layout window

Select from the menu the desired...