Book Image

The Business Analyst's Guide to Oracle Hyperion Interactive Reporting 11

By : Edward Cody
Book Image

The Business Analyst's Guide to Oracle Hyperion Interactive Reporting 11

By: Edward Cody

Overview of this book

Oracle Hyperion Interactive Reporting is one of the many products in the Oracle Enterprise Performance Management software suite, an industry-leading business intelligence software package. The primary focus of the Interactive Reporting product is to provide strong relational querying and data analysis capabilities. It also provides the capability to disseminate information throughout an enterprise. There is a very steep learning curve for most users of this tool.This book examines the power of the Interactive Reporting Web Client software, focusing on the key features of each section of the product. The author's experience in developing and supporting Interactive Reporting users is very well documented in this book. The goal is to educate you on every useful feature of the product, enabling you to gather information from various sources and process it to produce meaningful results that help you to spot problems and analyze trends necessary for business decisions.The book starts with a quick introduction to the product interface and the EPM Workspace, with explanation of importing and provisioning. It then takes you through each section from building a query and data model to building graphical displays of the data in a logical sequence. The report sections and interactive dashboards are also discussed at length. The book also covers advanced features of the product and provides you with the information necessary to build the foundation for creating complex queries and computations using the product.
Table of Contents (16 chapters)
The Business Analyst's Guide to Oracle Hyperion Interactive Reporting 11
Credits
About the Author
Acknowledgement
About the Reviewer
Preface
Index

Chart formatting and properties


The Chart section provides many options for modifying the display and format of a chart. If an item in the chart can be highlighted, it can be formatted. Formatting options include changing chart colors, font sizes, number formats, borders, headings, sizing, positioning, labels, and much more. Some of the formatting options can be set on the Right-Click menu and others can be achieved using the Format menu or Format Toolbar.

Chart properties

Many types of property windows exist in the Chart section. These property windows are accessed by highlighting the area of the chart and selecting the Properties menu item is selected from the Chart menu or Right-Click menu. The following is an example of the default Chart Properties window.

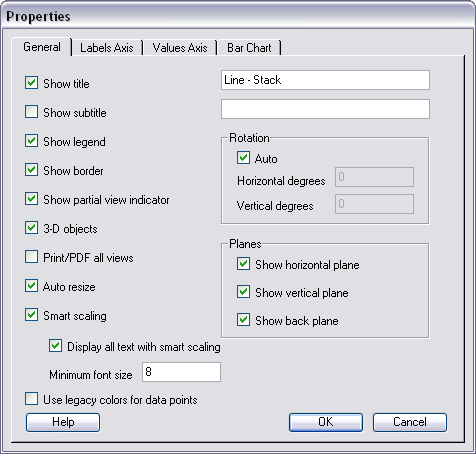
Notice the multiple tabs on the properties window. Each tab contains different settings for modifying the chart configuration, display, axis, and labels. The formatting items can be toggled as desired throughout the design and modification...