
Statspack was first introduced in Oracle Database 8i R8.1.6. We shall now look at how to use this tool.
To use Statspack, we have to set up a tablespace to store its structures; if we don't, in the installation process we have to choose an already existing tablespace—SYSAUX is the tablespace proposed by default. To create the tablespace, we will use the following command (with the necessary change in the datafile parameter, according to the platform used and the database location):
CREATE TABLESPACE statspack
DATAFILE '/u01/oracle/db/STATSPACK.DBF' SIZE 200 M REUSE
EXTENT MANAGEMENT LOCAL UNIFORM SIZE 512K
SEGMENT SPACE MANAGEMENT AUTO PERMANENT ONLINE;
To collect timing information in the dynamic performance views, we have to set the parameter TIMED_STATISTICS=TRUE, as shown in the recipe about the dynamic performance view.
Follow these steps to make use of the Statspack tool:
Connect to the database with a user with the
SYSDBAprivilege and run thespcreate.sqlscript from the$ORACLE_HOME/rdbms/adminrdirectory. This script will ask for a password to assign to thePERFSTATuser.We will then be asked for the tablespace to use. Select the previously created tablespace by entering its name (
STATSPACK). When the script asks for the temporary tablespace just press Enter to use the default temporary tablespace defined in the system.The script will create the user
PERFSTAT, identified by the password provided, and all the objects needed to run the tool.After the tool is created, we can collect statistics by executing the following procedure:
EXEC STATSPACK.snap;With this simple command, we have created a snapshot in the Statspack table.
When we have at least two snapshots, we can create a report using a pair of them. To do so, we will execute the
spreport.sqlscript.The script will show us the completed snapshots and we will be asked for the ID of the two which we want to compare.
The script will ask for the name to give to the report—the default will be
sp_id1_id2, whereid1andid2are the beginning and ending snapshots chosen in the previous step.
At the end of the process, we will find our Statspack report.
The spcreate.sql script internally launches the spcusr.sql, spctab.sql, and spcpkg.sql scripts. For every script, after the execution, we will find a corresponding file with the extension changed to .lis with the spool of the actions performed. In case anything goes wrong, we can launch the spdrop.sql script to rollback the actions performed by spcreate.sql.
A snapshot of Statspack contains information from the dynamic performance views. As these views are emptied at database start-up, it makes no sense to elaborate Statspack performance reports with the use of snapshots taken before and after a database shutdown.
The tables used to collect the data have names which start with STATS$, and are based on the corresponding V$ dynamic performance views. For example, the table STAT$DB_CACHE_ADVICE has the same columns of the view V$DB_CACHE_ADVICE, with three columns added in front of them, SNAP_ID, DBID, INSTANCE_NUMBER, which are used to identify the snapshot, the database, and the instance respectively.
Tip
If you want to use Statspack in an Oracle Real Application Cluster (RAC) environment, you have to launch STATSPACK.snap connecting to every instance you want to gather data from.
The report is divided into several sections:
General information about the database instance and the snapshots used
Cache sizes (buffer cache, shared pool, and log buffer)
Load profile (instance events per second and per transaction)
Instance efficiency indicators (buffer cache and shared pool statistics)
Top five timed events, showing the first five events sorted by total wait time in seconds
Host CPU and Instance CPU, showing the load on the CPU
Virtual Memory Paging and Memory Statistics
Wait events, foreground, background, and both foreground and background grouped together
SQL ordered by different criteria, by CPU, by elapsed time for DB, by gets, by executions, by parse calls, by sharable memory, by version count
Instance activity statistics
Tablespace and file I/O
Memory, buffer pool, and PGA statistics
Latch activity
Dictionary cache statistics
Library cache activity
SGA activity
init.oraparameters
We can configure Statspack to collect different amounts of data and to produce a report on specific SQL; we wish to automate snapshot collection, too.
We can configure Statspack to collect more or less data. The LEVEL parameter can be used to instruct the tool about the kind of information we want to store in the snapshot. The following table summarizes the available levels (the default level is 5):
|
Level |
Description |
|---|---|
|
0 |
General performance statistics |
|
5 |
Additional data: High resource usage SQL statements |
|
6 |
Additional data: SQL Plans and SQL Plan usage information for high resource usage SQL statements |
|
7 |
Additional data: Segment level statistics including logical and physical reads, row locks, and so on |
|
10 |
Additional statistics: Parent and Child latches |
We can use a different level parameter for a single snapshot, passing the corresponding level to the STATSPACK.snap procedure:
EXEC STATSPACK.snap(i_snap_level=>10);
If we want our selection made permanent for subsequent snapshots, we add another parameter to the procedure:
EXEC STATSPACK.snap(i_snap_level=>6, i_modify_parameter=>'true');
If we want to change the level of the snapshots without taking one, we will use the following statement:
EXECUTE STATSPACK.modify_statspack_parameter(i_snap_level=>6);
Statspack provides another script, sprepsql.sql, which allows us to elaborate a more detailed report on a specific SQL statement.
If we find a statement in the Statspack report that we want to investigate deeper, we can launch this script, indicating the beginning and ending snapshots, and the "Old Hash Value" (a pre-10g memory) of the SQL statement on which we want to elaborate the report.
If in our Statspack report (elaborated between the snapshots identified by 2 and 3) we have a row in the SQL ordered by CPU section that is similar to the one shown in the following screenshot:
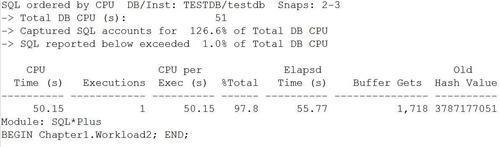
And we want to investigate the related statement, we can launch the sprepsql.sql script and indicate ID 2 as begin, ID 3 as end, and 3787177051 as Old Hash Value.
The script will ask for the filename and will then produce a detailed report for the statement analyzed.
We can automate snapshot generation in various ways. Besides using a Unix cron job or a Windows Scheduled Task, we can instruct the database to capture the snapshots with a simple job. There is the spauto.sql script in the $ORACLE_HOME/rdbms/admin directory to set up an hourly snapshot. The script uses DBMS_JOB to schedule the snapshots.
We can purge the no longer needed snapshots with the use of the spurge.sql script, indicating the ID of the first and the last snapshot to delete. Before deleting the data, we may want to export the PERFSTAT schema.
The sptrunc.sql script, instead, deletes all the data collected. All the scripts are in the $ORACLE_HOME/rdbms/admin directory.
To completely uninstall Statspack, there is the already mentioned spdrop.sql script, which has to be executed with SYSDBA privileges.