

It is quite common that the data miner has to rely on others to either provide data or interpret data, or both. Even when the data miner is working with data from their own organization there will be input variables that they don't have direct access to, or that are outside their day-to-day experience.
Are zero values normal? What about negative values? Null values? Are 1500 balance inquiries in a month even possible? How could a wallet cost $19,500? The concept of outliers is something that all analysts are familiar with. Even novice users of Modeler could easily find a dozen ways of identifying some. This recipe is about identifying outliers systematically and quickly so that you can produce a report designed to inspire curiosity.
There is no presumption that the data is in error, or that they should be removed. It is simply an attempt to put the information in the hands of Subject Matter Experts, so quirky values can be discussed in the earliest phases of the projects. It is important to provide whichever primary keys are necessary for the SMEs to look up the records. On one of the author's recent projects, the team started calling these reports quirk reports.
We will start with the Outlier Report.str stream that uses the TELE_CHURN_preprep data set.
Open the stream
Outlier Report.str.
Add a Data Audit node and examine the results.

Adjust the stream options to allow for 25 rows to be shown in a data preview. We will be using the preview feature later in the recipe.

Add a Statistics node. Choose Mean, Min, Max, and Median for the variables
DATA_gb,PEAK_mins, andTEXT_count. These three have either unusually high maximums or surprising negative values as shown in the Data Audit node.Consider taking a screenshot of the Statistics node for later use.

Add a Sort node. Starting with the first variable,
DATA_gb, sort in ascending order.
Add a Filter node downstream of the Sort node dropping
CHURN,DROPPED_CALLS, andLATE_PAYMENTS. It is important to work with your SME to know which variables put quirky values into context.
Preview the Filter node. Consider the following screenshot:

Reverse the sort, now choosing descending order, and preview the Filter node. Consider the following screenshot for later use:

Sort in descending order on the next variable,
PEAK_mins. Preview the Filter node.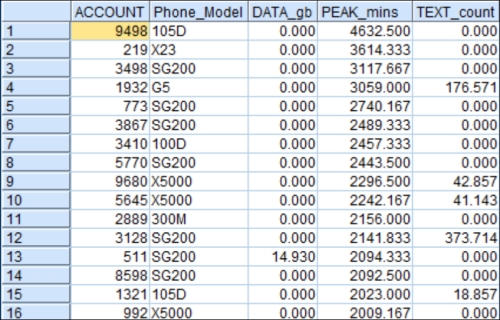
Finally sort the variable,
TEXT_count, in descending order and preview the Filter node.
Examine
Outliers.docxto see an example of what this might look like in Word.
There is no deep theoretical foundation to this recipe; it is as straightforward as it seems. It is simply a way of quickly getting information to an SME. They will not be frequent Modeler users. Also summary statistics only give them a part of the story. Providing the min, max, mean and median alone will not allow an SME to give you the information that you need. If there is a usual min such as a negative value, you need to know how many negatives there are, and need at least a handful of actual examples with IDs. An SME might look up to values in their own resources and the net result could be the addition of more variables to the analysis. Alternatively, negative values might be turned into nulls or zeros. Negative values might be deemed out of scope and removed from the analysis. There is no way to know until you assess why they are negative. Sometimes values that are exactly zero are of interest. High values, NULL values, and rare categories are all of potential interest. The most important thing is to be curious (and pleasantly persistent) and to inspire collaborators to be curious as well.