

QlikView is software that is best implemented using agile project management methods. This is especially true when we work closely with the business user to deliver data visualization and analysis that provide real value.
The exact agile project management method that we use is not important. The most popular methods are Scrum, Lean, and Extreme Programming (XP). We can find plenty of books and other material that help us decide which method best fits our situation. However, we do take time in this book to review the overall principles that define agile project management:
"Manifesto for Agile Software Development
We are uncovering better ways of developing software by doing it and helping others do it. Through this work we have come to value:
Individuals and interactions over processes and tools
Working software over comprehensive documentation
Customer collaboration over contract negotiation
Responding to change over following a plan
That is, while there is value in the items on the right, we value the items on the left more.
Kent Beck, Mike Beedle, Arie van Bennekum, Alistair Cockburn, Ward Cunningham, Martin Fowler, James Grenning, Jim Highsmith, Andrew Hunt, Ron Jeffries, Jon Kern, Brian Marick, Robert C. Martin, Steve Mellor, Ken Schwaber, Jeff Sutherland, Dave Thomas
© 2001, the above authors, this declaration may be freely copied in any form, but only in its entirety through this notice."
We take the liberty to mix a few key words from the different agile methods throughout the rest of the book. The following is a list of the most important terms that we will use, and the context in which we will use them. We also reference the specific method that uses the term.
In each chapter we will describe a series of business user requirements using user stories. A user story is common to all agile methods, and describes the business user requirements from the user's perspective in their own words. The following is an example user story from the sales department:
"As a salesperson, I would like know who my most important customers are so that I can focus my attention on them."
An epic is a collection of multiple user stories with a common theme.
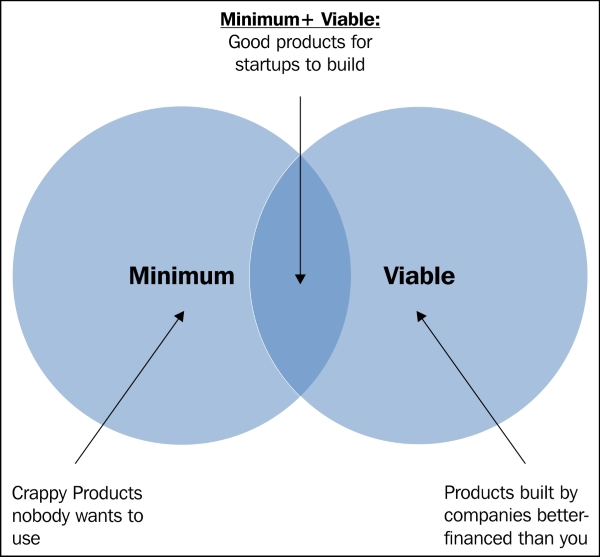
User stories have a way of helping us look through the eyes of the business users as we develop the best ways to visualize data. This user empathy is important when we create a Minimum Viable Product.
Henry Ford famously said, "If I had asked people what they wanted they would have said faster horses." If we always ask the business users what they want, they are likely to say prettier Excel tables. We often have to depend on our data entrepreneur, or ourselves as data visualization designers, to develop new ways of analyzing data in QlikView. Then, we have to sell the idea to the business user. In these cases, we are new product developers more than we are software developers.
In his book Lean Startup, Eric Ries explains how startups use agile methods for new product development. He recommends building a Minimum Viable Product (MVP), measuring how a customer uses the MVP, and then learning how to improve it.
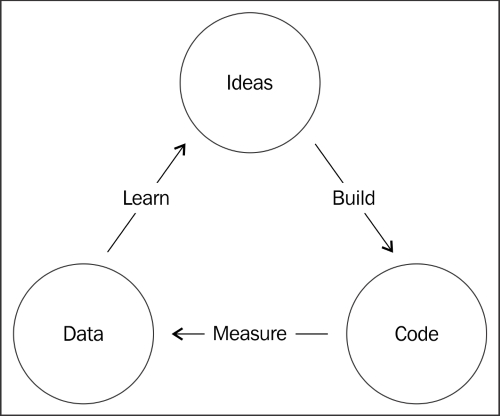
A QlikView prototype might, for example, only show that it is possible to create a bar chart. A QlikView MVP is a working application that may have only a bar chart, but it displays pertinent information to the user. We can then learn from the user's interaction with the MVP and listen to his or her feedback. We go through the following iterative process each time we decide whether or not to build additional functionality into the MVP. We usually continue this loop pictured here until the value we can add to the MVP is less than the cost to develop it:
Note
Even if we have already developed a QlikView application for a department, we should continue to use the MVPs to introduce new functionality.
Whether we realize it or not, we may already follow a process similar to the one in the previous diagram when we develop data visualization and analysis in QlikView. As we begin to master QlikView, we should continue to follow the same iteration, or use a more well-established agile method like Scrum. However, we should avoid using waterfall project management methodologies that don't take advantage of QlikView's flexibility.
In each chapter, we will teach you to create several different visualizations that you can use to create a QlikView MVP using your own business data. Then, you can listen to your business users' feedback and learn how to incrementally improve it based on your business's unique necessities. In this way, we will help you avoid the trap of replicating Excel, or whatever other tool you had previously used, in QlikView.
Note
Data Visualization Strategy 4: Collaborate closely with the business user using agile project management methods.
Data Visualization Strategy 5: Propose our own solutions to business problems using new technologies like QlikView, and avoid only reproducing legacy reporting methods.
Along with collaborating closely with the business users and their needs, we also have to be concerned with the overall technical architecture of our solution. Our first technical architecture requirement is to establish a common framework that will make developing QlikView throughout our whole business easier.