

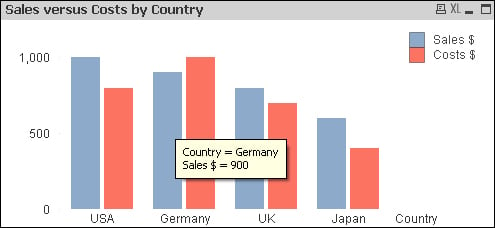
The default pop up for a QlikView bar chart is useful but is not always exactly what you want.
The format is as follows:
Dimension name = value
Expression label = value
Now, we may not like this pop up and wish to display the values differently or add different formats. We may even want to include additional information.
In the preceding example, the pop up shows the value of Sales $ for Germany. If I want to see the value of the Costs $, I need to hover over the Costs $ bar. And what if I wanted to see Margin $ or Margin %?
Create a new QlikView document and save it to a folder. Edit the script (Ctrl + E or the File menu – Edit Script).
Enter the following script:
LOAD * INLINE [
    Country, Sales, Costs
    USA, 1000, 800
    UK, 800, 700
    Germany, 900, 1000
    Japan, 600, 400
];
Tip
Downloading the example code
You can download the example code files for all Packt books you have purchased from your account at http://www.packtpub.com. If you purchased this book elsewhere, you can visit http://www.packtpub.com/support and register to have the files e-mailed directly to you.
Use the following steps to create a new bar chart and add custom labels:
Create a new bar chart with the following characteristics:
Dimension
CountryExpression 1
Sum(Sales)Expression 2
Sum(Costs)Click on Finish.
You should see a bar chart with two bars for each country. Confirm that the pop up on each bar displays as expected.
Open the chart properties.

Click on the Presentation tab and deselect the Pop-up Labels checkbox. Click on OK and note that there are no longer any pop-up labels appearing.
Edit the properties again and click on the Expressions tab. Click on the Add… button and enter the following expression:
='Sales : ' & Num(Sum(Sales), '#,##0')
Click on OK.

Deselect the Bar option for this expression and turn on the Text as Pop-up option. Click on OK.
Edit the properties again and edit the pop-up expression as follows:
= Country & chr(10)
& 'Sales : ' & Num(Sum(Sales), '$(MoneyFormat)') & chr(10)
& 'Costs : ' & Num(Sum(Costs), '$(MoneyFormat)') & chr(10)
& 'Margin : ' & Num(Sum(Sales)-Sum(Costs), '$(MoneyFormat)')
& chr(10) & 'Margin % : '
& Num(1-(Sum(Costs)/Sum(Sales)), '0.0%')
Click on OK on the expression editor and then click on OK to close the properties.
By turning off the Bar option for the expression, QlikView will not try and evaluate the expression as a value and will not try to render a bar for it. By turning on the Text as Pop-up option, we tell QlikView to calculate the text of the expression and display it in the pop up.
We also had to turn off the default pop-up option in the Presentation tab or else it would display both (which might be what you want, have a play with it).
The chr function is useful to know about adding, so called, non-printable characters into your output. chr(10) is a line feed that moves the text onto the next line.