Book Image

QlikView for Developers Cookbook

By : Stephen Redmond
Book Image

QlikView for Developers Cookbook

By: Stephen Redmond

Overview of this book

QlikView has been around since 1993, but has only really taken off in recent years as a leader in the in-memory BI space and, more recently, in the data discovery area. QlikView features the ability to consolidate relevant data from multiple sources into a single application, as well as an associative data model to allow you to explore the data to a way your brain works, state-of-the-art visualizations, dashboard, analysis and reports, and mobile data access. QlikView for Developers Cookbook builds on your initial training and experiences with QlikView to help you become a better developer. This book features plenty of hands-on examples of many challenging functions. Assuming a basic understanding of QlikView development, this book provides a range of step-by-step exercises to teach you different subjects to help build your QlikView developer expertise. From advanced charting and layout to set analysis; from advanced aggregations through to scripting, performance, and security, this book will cover all the areas that you need to know about. The recipes in this book will give you a lot of the information that you need to become an excellent QlikView developer.
Table of Contents (19 chapters)
QlikView for Developers Cookbook
Credits
Foreword
About the Author
About the Reviewers
www.PacktPub.com
Preface
Index

Creating a line chart with variable width lines


This is an interesting technique that has some rare enough applications. However, it could be a useful one to have in your arsenal.

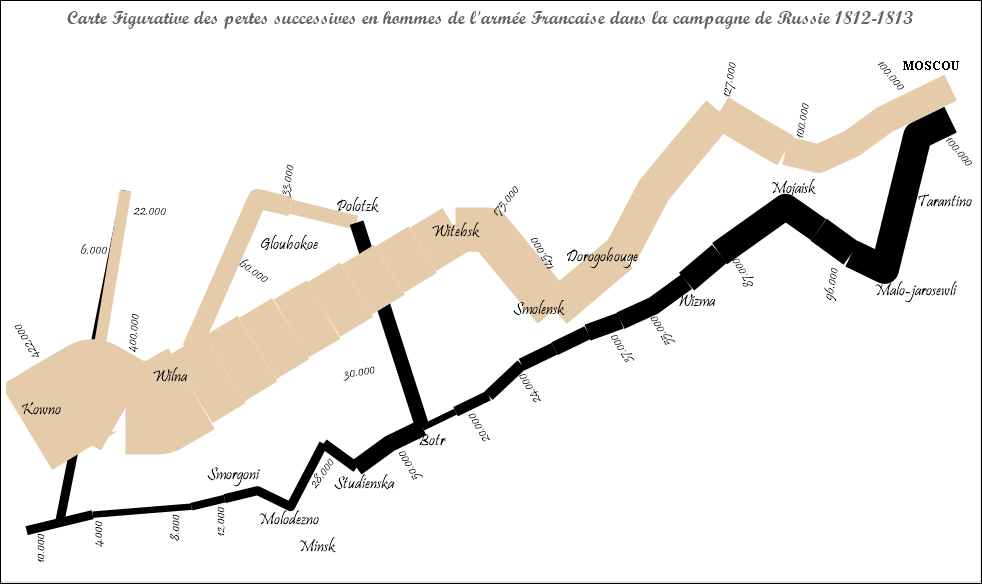
I used it to create my Homage to Minard (http://qliktips.blogspot.ie/2012/06/homage-to-minard.html).

Getting ready

Load the following script:

LOAD * INLINE [
    Country, Sales, Target, Month
    USA, 1000, 1500, 2013-01-01
    USA, 1200, 1600, 2013-02-01
    USA, 3500, 1800, 2013-03-01
    USA, 2500, 2000, 2013-04-01
    USA, 3000, 2500, 2013-05-01
    USA, 2500, 3000, 2013-06-01
    UK, 1000, 1500, 2013-01-01
    UK, 1700, 1600, 2013-02-01
    UK, 2200, 1800, 2013-03-01
    UK, 2000, 2000, 2013-04-01
    UK, 1300, 2500, 2013-05-01
    UK, 1900, 3000, 2013-06-01
];

How to do it…

These steps will show you how to create a line chart with variable width lines:

  1. Create a new line chart. Add Month and Country as dimensions.

  2. On the Expressions tab, add this expression:

    Sum(Sales)
  3. Click on the + sign beside the expression and enter this expression for the Line Style property:

    ='<W' & 
    Round(0.5 + (7 * Sum(Sales)/Sum(Target)), 0.1) 
    & '>'
  4. Still on the Expressions tab, in the Display Options section, select Symbol and select Dots from the drop-down menu:

  5. Set the Line Width property to 1 pt and the Symbol Size property to 2 pt. Click on Finish:

  6. The chart shows the values as normal; however, the lines are thicker where performance versus target is better:

How it works…

The Line Style property allows you to specify a width attribute for the line chart. This is a tag in the format:

<Wn.n>

Where, n.n is a number between 0.5 and 8.0.

We use the Round function here to round the value down to one decimal place.

We add the dots style symbol because they help fill in some gaps in the lines, especially where there are sharper corners.

There's more…

There are a few applications of this. In the same blog post as the Minard chart, I have shown an image of a chart using this function and a smooth line option.