
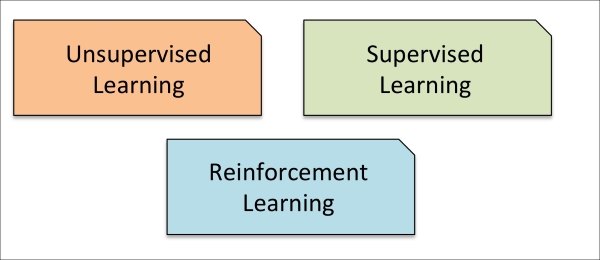
In this section, we will take a look at the three types of machine learning: supervised learning, unsupervised learning, and reinforcement learning. We will learn about the fundamental differences between the three different learning types and, using conceptual examples, we will develop an intuition for the practical problem domains where these can be applied:
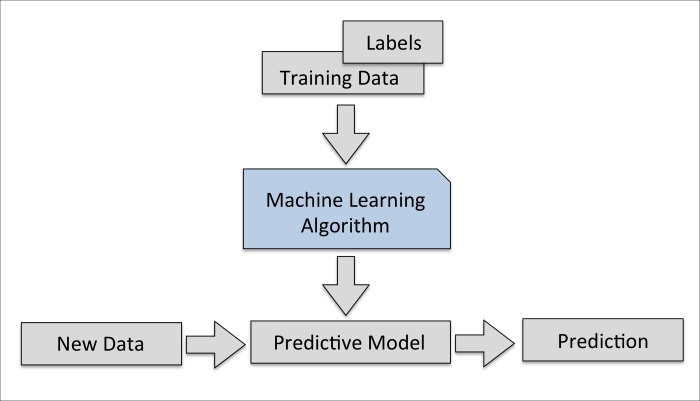
The main goal in supervised learning is to learn a model from labeled training data that allows us to make predictions about unseen or future data. Here, the term supervised refers to a set of samples where the desired output signals (labels) are already known.
Considering the example of e-mail spam filtering, we can train a model using a supervised machine learning algorithm on a corpus of labeled e-mail, e-mail that are correctly marked as spam or not-spam, to predict whether a new e-mail belongs to either of the two categories. A supervised learning task with discrete class labels, such as in the previous e-mail spam-filtering example, is also called a classification task. Another subcategory of supervised learning is regression, where the outcome signal is a continuous value:
Classification is a subcategory of supervised learning where the goal is to predict the categorical class labels of new instances based on past observations. Those class labels are discrete, unordered values that can be understood as the group memberships of the instances. The previously mentioned example of e-mail-spam detection represents a typical example of a binary classification task, where the machine learning algorithm learns a set of rules in order to distinguish between two possible classes: spam and non-spam e-mail.
However, the set of class labels does not have to be of a binary nature. The predictive model learned by a supervised learning algorithm can assign any class label that was presented in the training dataset to a new, unlabeled instance. A typical example of a multi-class classification task is handwritten character recognition. Here, we could collect a training dataset that consists of multiple handwritten examples of each letter in the alphabet. Now, if a user provides a new handwritten character via an input device, our predictive model will be able to predict the correct letter in the alphabet with certain accuracy. However, our machine learning system would be unable to correctly recognize any of the digits zero to nine, for example, if they were not part of our training dataset.
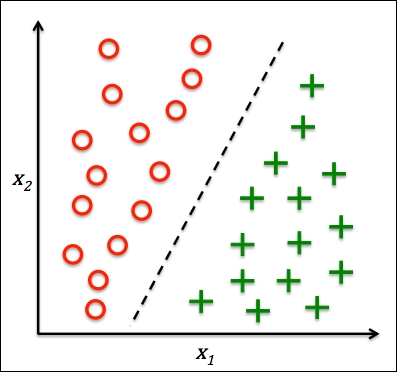
The following figure illustrates the concept of a binary classification task given 30 training samples: 15 training samples are labeled as negative class (circles) and 15 training samples are labeled as positive class (plus signs). In this scenario, our dataset is two-dimensional, which means that each sample has two values associated with it:  and
and  . Now, we can use a supervised machine learning algorithm to learn a rule—the decision boundary represented as a black dashed line—that can separate those two classes and classify new data into each of those two categories given its and values:
We learned in the previous section that the task of classification is to assign categorical, unordered labels to instances. A second type of supervised learning is the prediction of continuous outcomes, which is also called regression analysis. In regression analysis, we are given a number of predictor (explanatory) variables and a continuous response variable (outcome), and we try to find a relationship between those variables that allows us to predict an outcome.
For example, let's assume that we are interested in predicting the Math SAT scores of our students. If there is a relationship between the time spent studying for the test and the final scores, we could use it as training data to learn a model that uses the study time to predict the test scores of future students who are planning to take this test.
Note
The term regression was devised by Francis Galton in his article Regression Towards Mediocrity in Hereditary Stature in 1886. Galton described the biological phenomenon that the variance of height in a population does not increase over time. He observed that the height of parents is not passed on to their children but the children's height is regressing towards the population mean.
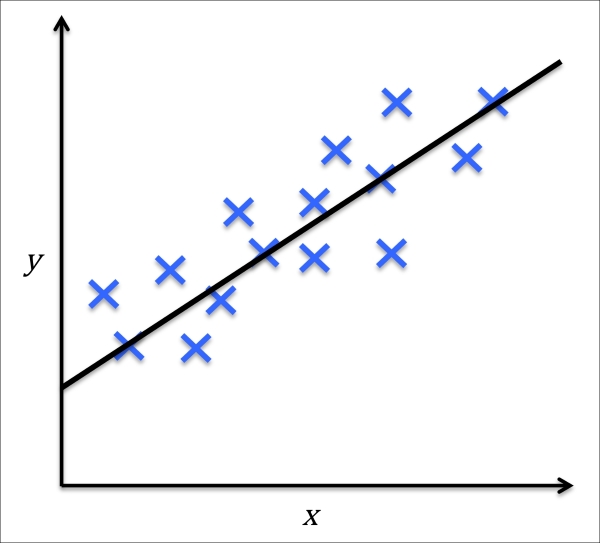
The following figure illustrates the concept of linear regression. Given a predictor variable x and a response variable y, we fit a straight line to this data that minimizes the distance—most commonly the average squared distance—between the sample points and the fitted line. We can now use the intercept and slope learned from this data to predict the outcome variable of new data:
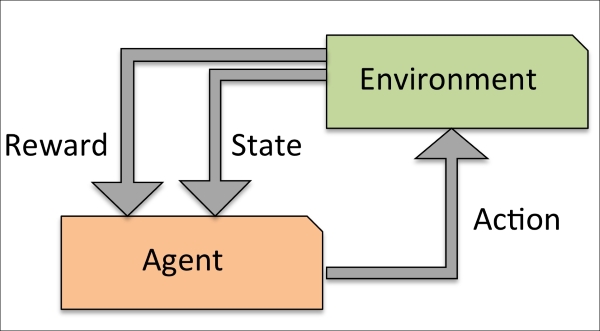
Another type of machine learning is reinforcement learning. In reinforcement learning, the goal is to develop a system (agent) that improves its performance based on interactions with the environment. Since the information about the current state of the environment typically also includes a so-called reward signal, we can think of reinforcement learning as a field related to supervised learning. However, in reinforcement learning this feedback is not the correct ground truth label or value, but a measure of how well the action was measured by a reward function. Through the interaction with the environment, an agent can then use reinforcement learning to learn a series of actions that maximizes this reward via an exploratory trial-and-error approach or deliberative planning.
A popular example of reinforcement learning is a chess engine. Here, the agent decides upon a series of moves depending on the state of the board (the environment), and the reward can be defined as win or lose at the end of the game:
In supervised learning, we know the right answer beforehand when we train our model, and in reinforcement learning, we define a measure of reward for particular actions by the agent. In unsupervised learning, however, we are dealing with unlabeled data or data of unknown structure. Using unsupervised learning techniques, we are able to explore the structure of our data to extract meaningful information without the guidance of a known outcome variable or reward function.
Clustering is an exploratory data analysis technique that allows us to organize a pile of information into meaningful subgroups (clusters) without having any prior knowledge of their group memberships. Each cluster that may arise during the analysis defines a group of objects that share a certain degree of similarity but are more dissimilar to objects in other clusters, which is why clustering is also sometimes called "unsupervised classification." Clustering is a great technique for structuring information and deriving meaningful relationships among data, For example, it allows marketers to discover customer groups based on their interests in order to develop distinct marketing programs.
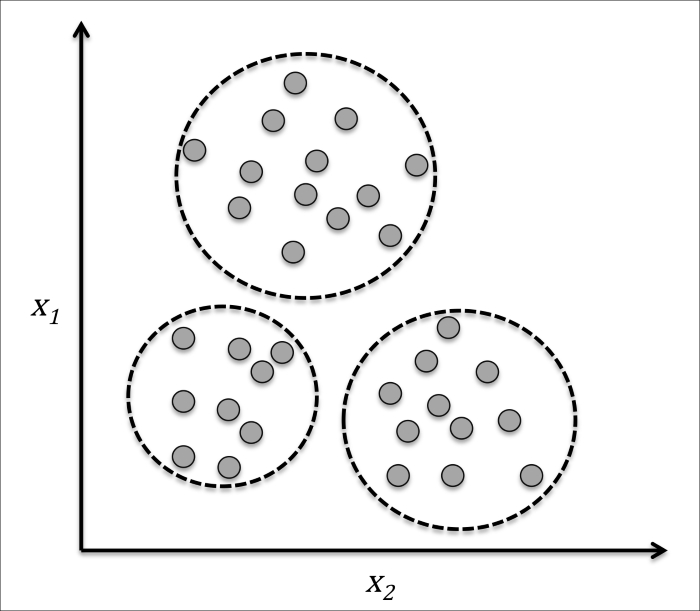
The figure below illustrates how clustering can be applied to organizing unlabeled data into three distinct groups based on the similarity of their features and :
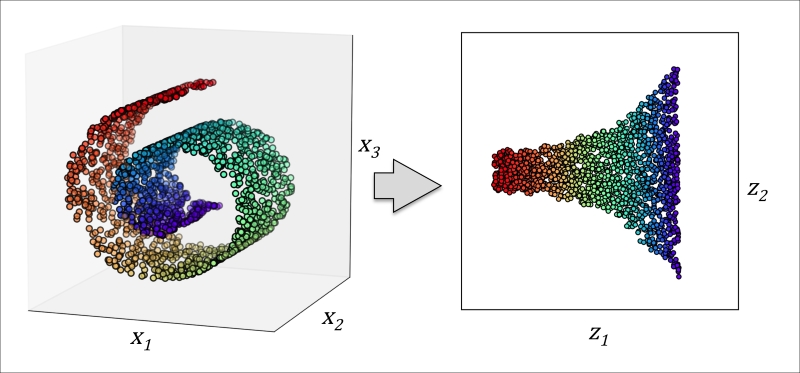
Another subfield of unsupervised learning is dimensionality reduction. Often we are working with data of high dimensionality—each observation comes with a high number of measurements—that can present a challenge for limited storage space and the computational performance of machine learning algorithms. Unsupervised dimensionality reduction is a commonly used approach in feature preprocessing to remove noise from data, which can also degrade the predictive performance of certain algorithms, and compress the data onto a smaller dimensional subspace while retaining most of the relevant information.
Sometimes, dimensionality reduction can also be useful for visualizing data—for example, a high-dimensional feature set can be projected onto one-, two-, or three-dimensional feature spaces in order to visualize it via 3D- or 2D-scatterplots or histograms. The figure below shows an example where non-linear dimensionality reduction was applied to compress a 3D Swiss Roll onto a new 2D feature subspace: