
Now that we have discussed the three broad categories of machine learning—supervised, unsupervised, and reinforcement learning—let us have a look at the basic terminology that we will be using in the next chapters. The following table depicts an excerpt of the Iris dataset, which is a classic example in the field of machine learning. The Iris dataset contains the measurements of 150 iris flowers from three different species: Setosa, Versicolor, and Virginica. Here, each flower sample represents one row in our data set, and the flower measurements in centimeters are stored as columns, which we also call the features of the dataset:
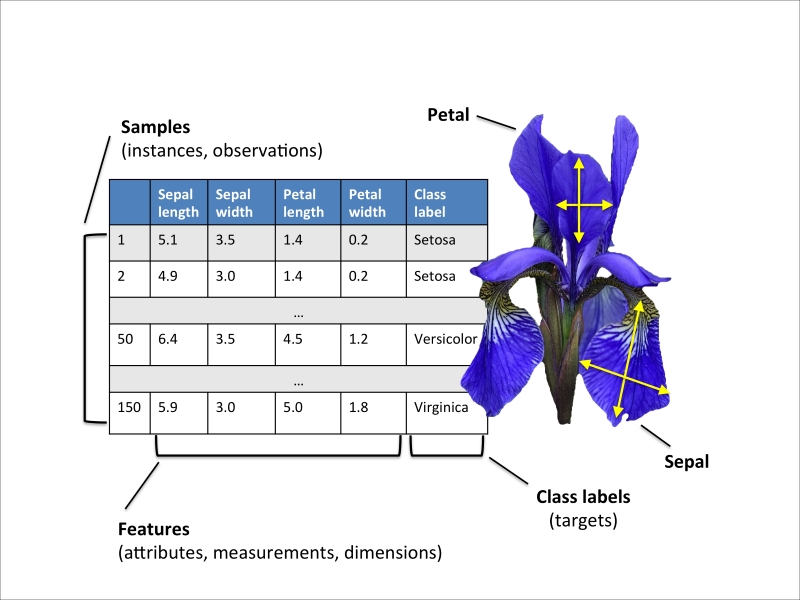
To keep the notation and implementation simple yet efficient, we will make use of some of the basics of linear algebra. In the following chapters, we will use a matrix and vector notation to refer to our data. We will follow the common convention to represent each sample as separate row in a feature matrix  , where each feature is stored as a separate column.
The Iris dataset, consisting of 150 samples and 4 features, can then be written as a  matrix
  :
:

Note
For the rest of this book, we will use the superscript (i) to refer to the ith training sample, and the subscript j to refer to the jth dimension of the training dataset.
We use lower-case, bold-face letters to refer to vectors  and upper-case, bold-face letters to refer to matrices, respectively
  . To refer to single elements in a vector or matrix, we write the letters in italics (
 or
or  , respectively).
For example,  refers to the first dimension of flower sample 150, the sepal length. Thus, each row in this feature matrix represents one flower instance and can be written as four-dimensional row vector
  ,
, 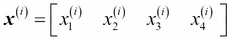 .
.
Each feature dimension is a 150-dimensional column vector  , for example:
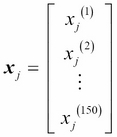
.
Similarly, we store the target variables (here: class labels) as a 150-dimensional column vector 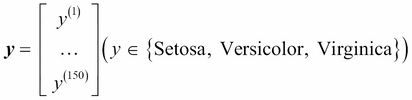 .
.