Contour maps have also been referred to as isometric maps or isopleth maps. Contour maps are used to display data related to temperature or topographic information. Most of the time, contour maps are used to display maps related to geology or mountains. The contour lines represent which sections of the mountains are steeper based on how close the contour lines are drawn from each other.
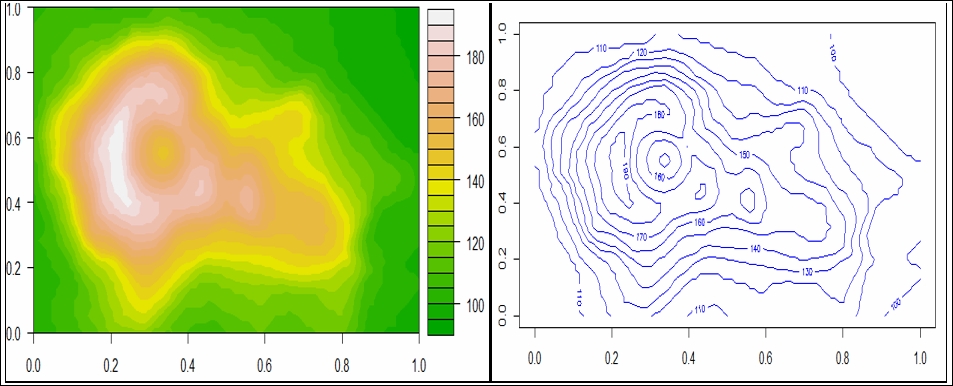
We can generate a contour map in R using the contour() function and also add a color to the contour using the filled.contour() function:
In order to plot a simple contour plot, we will use the contour() function available with the basic R plotting functionality. The first argument passed in the contour() function is the data. The volcano dataset consists of topographic information on Auckland's Mauga...