

As a programmer, debugging is the most common task faced on a daily basis. The simplest debugging method is to insert a print statement at every desired location; however, this method is rather inefficient. Here, we will illustrate how to use some R debugging tools to help accelerate the debugging process.
Perform the following steps to debug an R function:
First, we create a
debugfuncfunction withxandyas argument, but we only returnx:>debugfunc<- function(x, y){ + x <- y + 2 + x + } >debug(2)
We then pass only
2todubugfunc:>debugfunc(2) Error in debugfunc(2) : argument "y" is missing, with no default
Next, we apply the
debugfunction ontodebugfunc:>debug(debugfunc)At this point, we pass
2todebugfuncagain:>debugfunc(2) debugging in: debugfunc(2) debug at #1: { x <- y + 2 x }
You can type
helpto list all possible commands:Browse[2]> help n next s step into f finish c or cont continue Q quit where show stack help show help <expr> evaluate expression
Then, you can type
nto move on to the next debugging step:Browse[2]> n debug at #2: x <- y + 2
At this point, you can use
objectsorlsto list variables:Browse[2]> objects() [1] "x" "y" Browse[2]>ls() [1] "x" "y"
At each step, you can type the variable name to obtain the current value:
Browse[2]> x
[1] 2
Browse[2]> y
Error: argument "y" is missing, with no default
At the last step, you can quit the debug mode by typing the
Qcommand:Browse[2]> QYou can then leave the debug mode using the
undebugfunction:>undebug(debugfunc)Moving on, let's debug the function using the
browserfunction:debugfunc2<- function(x, y){ x <- 3 browser() x <- y + 2 x }
The debugger will then step right into where the
browserfunction is located:>debugfunc2(2) Called from: debugfunc2(2) Browse[1]> n debug at #4: x <- y + 2
To recover the debug process, type
recoverduring the browsing process:Browse[2]> recover() Enter a frame number, or 0 to exit 1: debugfunc2(2) Selection: 1 Browse[4]> Q
On the other hand, you can use the
tracefunction to insert code into thedebugfunction at step 4:>trace(debugfunc2, quote(if(missing(y)){browser()}), at=4) [1] "debugfunc2"
You can then track the debugging process from step 4, and determine the inserted code:
>debugfunc2(3)
Called from: debugfunc2(3)
Browse[1]> n
debug at #4: {
.doTrace(if (missing(y)) {
browser()
}, "step 4")
x <- y + 2
}
Browse[2]> n
debug: .doTrace(if (missing(y)) {
browser()
}, "step 4")
Browse[2]> Q
On the other hand, you can track the usage of certain functions with the
tracefunction:>debugfunc3<- function(x, y){ + x <- 3 + sum(x) + x <- y + 2 + sum(x,y) + x + } >trace(sum) >debugfunc3(2,3) trace: sum(x) trace: sum(x, y) [1] 5
You can also print the calling stack of a function with the
tracebackfunction:>lm(y~x) Error in eval(expr, envir, enclos) : object 'y' not found >traceback() 7: eval(expr, envir, enclos) 6: eval(predvars, data, env) 5: model.frame.default(formula = y ~ x, drop.unused.levels = TRUE) 4: stats::model.frame(formula = y ~ x, drop.unused.levels = TRUE) 3: eval(expr, envir, enclos) 2: eval(mf, parent.frame()) 1: lm(y ~ x)
As it is inevitable for all code to include bugs, an R programmer has to be well prepared for them with a good debugging toolset. In this recipe, we showed you how to debug a function with the debug, browser, trace, and traceback functions.
In the first section, we explained how to debug a function by applying debug to an existing function. We first made a function named debugfunc, with two input arguments: x and y. Then, we applied a debug function onto debugfunc. Here, we applied the debug function on the name, argument, or function. At this point, whenever we invoke debugfunc, our R console will enter into a browser mode with Browse as the prompt at the start of each line.
Browser mode enables us to make a single step through the execution of the function. We list the single-letter commands that one can use while debugging here:
In the following operations, we first use help to list all possible commands. Then, we type n to step to the next line. Next, we type objects and ls to list all current objects. At this point, we can type the variable name to find out the current value of each object. Finally, we can type Q to quit debugging mode, and use undebug to unflag the function.
Besides using the debug function, we can insert the browser function within the code to debug it. After we have inserted browser() into debugfunc2, whenever we invoke the function, the R function will step right into the next line below the browser function. Here, we can perform any command mentioned in the previous command table. If you want to move among frames or return to the top level of debugging mode, we can use the recover function. Additionally, we can use the trace function to insert debugging code into the function. Here, we assign what to trace as debugfunc2, and set the tracer to examine whether y is missing. If y is missing, it will execute the browser() function. At that argument, we set 4 to the argument so that the tracer code will be inserted at line 4 of debugfunc2. Then, when we call the debugfunc2 function, the function enters right into where the tracer is located and executes the browser function as the y argument is missing.
Finally, we introduce the traceback function, which prints the calling stack of the function. At this step, we pass two unassigned parameters, x and y, into an lm linear model fitting function. As we do not assign any value to these two parameters, the function returns an error message in the console output. To understand the calling stack sequence, we can use the traceback function to print out the stack.
Besides using the command line, we can use RStudio to debug functions:
First, you select
Toggle Breakpointfrom the dropdown menu ofDebug: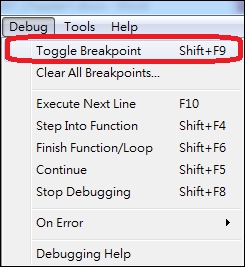
Figure 1: Toggle Breakpoint
Then, you set breakpoint on the left of line number:
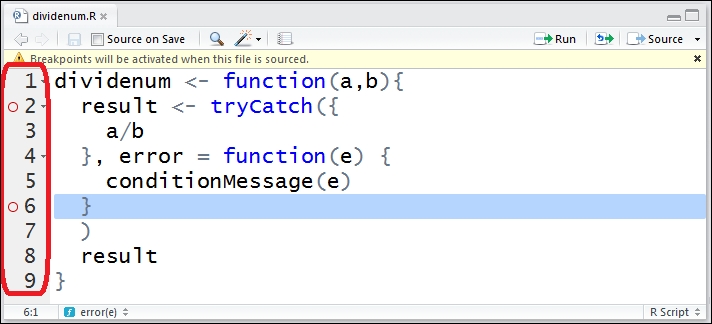
Figure 2: Set breakpoint
Next, you save the code file and click on
Sourceto activate the debugging process: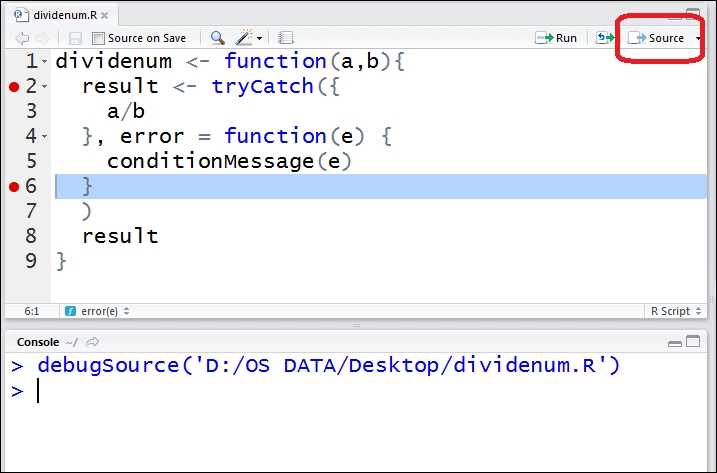
Figure 3: Activate debugging process
Finally, when you invoke the function, your R console will then enter into
Browsemode: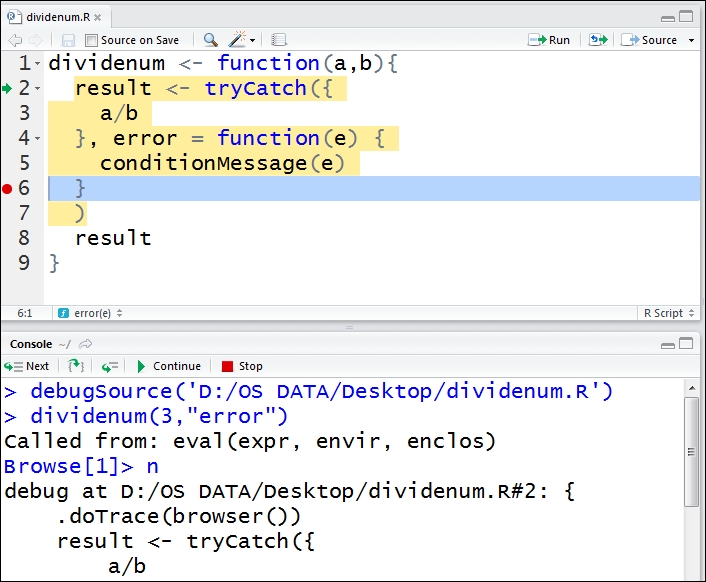
Figure 4: Browse the function
You can now use the command line or dropdown menu of Debug to debug the function:
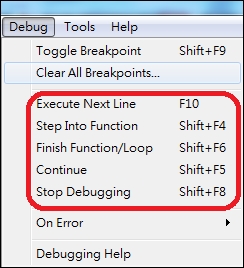
Figure 5: Use debug functions