

As we all know, Fourier analysis expresses a function as a sum of periodic components (a combination of sine and cosine functions) and these components are able to recover the original function. It has great applications in digital signal processing such as filtering, interpolation, and more, so we don't want to talk about Fourier analysis in NumPy without giving details of any application we can use it for. For this, we need a module to visualize it.
Matplotlib is the module we are going to use in this chapter for visualization. Please download and install it from the official website: http://matplotlib.org/downloads.html. Or if you are using Scientific Python distributions such as Anaconda, then matplotlib should already be included.
We are going to write a simple display function called show() to help us with the practice examples in this chapter. The function output will be as shown in the following graph:
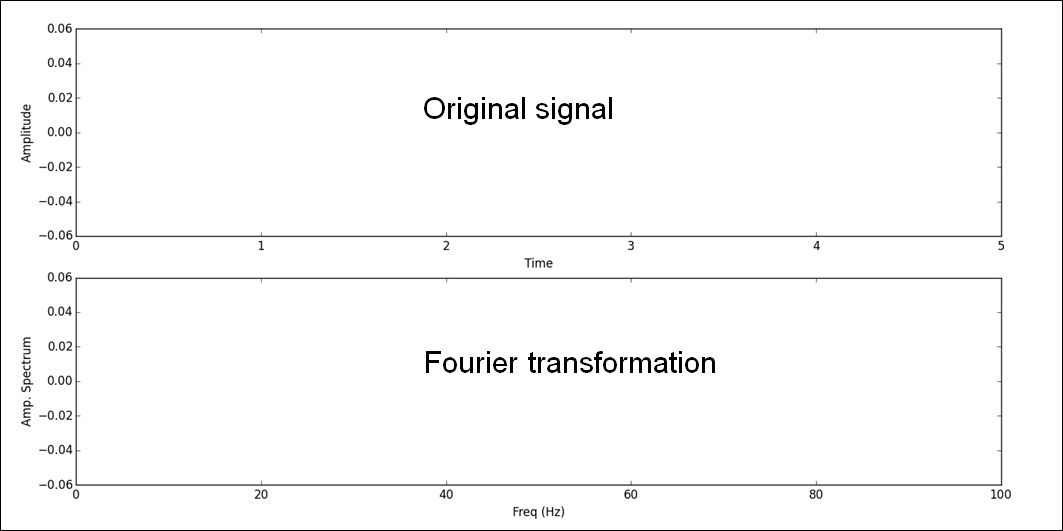
The upper plot area shows the original functions (signal), and...