Book Image

Python Data Visualization Cookbook (Second Edition)

Book Image

Python Data Visualization Cookbook (Second Edition)

Overview of this book

Python Data Visualization Cookbook will progress the reader from the point of installing and setting up a Python environment for data manipulation and visualization all the way to 3D animations using Python libraries. Readers will benefit from over 60 precise and reproducible recipes that will guide the reader towards a better understanding of data concepts and the building blocks for subsequent and sometimes more advanced concepts. Python Data Visualization Cookbook starts by showing how to set up matplotlib and the related libraries that are required for most parts of the book, before moving on to discuss some of the lesser-used diagrams and charts such as Gantt Charts or Sankey diagrams. Initially it uses simple plots and charts to more advanced ones, to make it easy to understand for readers. As the readers will go through the book, they will get to know about the 3D diagrams and animations. Maps are irreplaceable for displaying geo-spatial data, so this book will also show how to build them. In the last chapter, it includes explanation on how to incorporate matplotlib into different environments, such as a writing system, LaTeX, or how to create Gantt charts using Python.
Table of Contents (16 chapters)
Python Data Visualization Cookbook Second Edition
Credits
About the Authors
About the Reviewer
www.PacktPub.com
Preface
Index

Customizing grids


A grid is usually handy to have under lines and charts as it helps the human eye spot differences in patterns and compare plots visually in the figure. To be able to set up how visibly, how frequently, and in what style the grid is displayed—or whether it is displayed at all—we should use matplotlib.pyplot.grid.

In this recipe, you will be learning how to turn the grid on and off and how to change the major and minor ticks on a grid.

Getting ready

The most frequent grid customization is reachable in the matplotlib.pyplot.grid helper function.

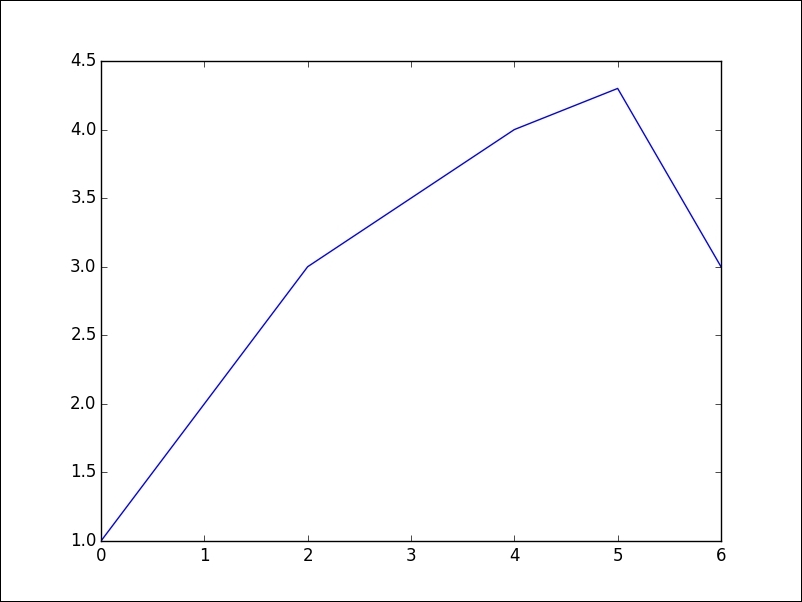
To see the interactive effect of this, you should run the following under ipython. The basic call to plt.grid() will toggle the grid visibility in the current interactive session started by the last IPythonPyLab environment:

In [1]: plt.plot([1,2,3,3.5,4,4.3,3])
Out[1]: [<matplotlib.lines.Line2D at 0x3dcc810>]

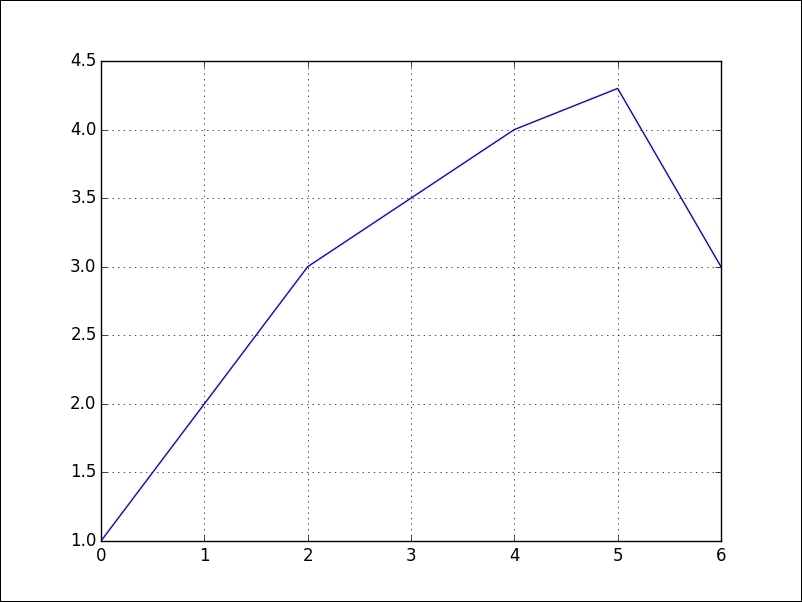
Now, we can toggle the grid on the same figure:

In [2]: plt.grid()

We turn the grid back on, as shown in the following plot:

We...