
So far this chapter, we've reduced the size of our dataset by filtering both rows and columns. Often we'll want to add rows to a dataset instead, and Incanter supports this in several ways.
Firstly, we can choose whether to replace an existing column within the dataset or append an additional column to the dataset. Secondly, we can choose whether to supply the new column values to replace the existing column values directly, or whether to calculate the new values by applying a function to each row of the data.
The following chart lists our options and the corresponding Incanter function to use:
|
Replace data |
Append data | |
|---|---|---|
|
By providing a sequence |
|
|
|
By applying a function |
|
|
When transforming or deriving a column based on a function, we pass the name of the new column to create, a function to apply for each row, and also a sequence of existing column names. The values contained in each of these existing columns will comprise the arguments to our function.
Let's show how to use the i/add-derived-column function with reference to a real example. The 2010 UK general election resulted in a hung parliament with no single party commanding an overall majority. A coalition between the Conservative and Liberal Democrat parties was formed. In the next section we'll find out how many people voted for either party, and what percentage of the total vote this was.
To find out what percentage of the electorate voted for either the Conservative or Liberal Democrat parties, we'll want to calculate the sum of votes for either party. Since we're creating a new field of data based on a function of the existing data, we'll want to use the i/add-derived-column function.
(defn ex-1-26 []
  (->> (load-data :uk-scrubbed)
       (i/add-derived-column :victors [:Con :LD] +)))
If we run this now, however, an exception will be generated:
ClassCastException java.lang.String cannot be cast to java.lang.Number clojure.lang.Numbers.add (Numbers.java:126)
Unfortunately Clojure is complaining that we're trying to add a java.lang.String. Clearly either (or both) the Con or the LD columns contain string values, but which? We can use frequencies again to see the extent of the problem:
(->> (load-data :uk-scrubbed)
     ($ "Con")
     (map type)
     (frequencies))

;; {java.lang.Double 631, java.lang.String 19}

(->> (load-data :uk-scrubbed)
     ($ "LD")
     (map type)
     (frequencies))

;; {java.lang.Double 631, java.lang.String 19}
Let's use the i/$where function we encountered earlier in the chapter to inspect just these rows:
(defn ex-1-27 []
  (->> (load-data :uk-scrubbed)
       (i/$where #(not-any? number? [(% "Con") (% "LD")]))
       (i/$ [:Region :Electorate :Con :LD])))

;; |           Region | Electorate | Con | LD |
;; |------------------+------------+-----+----|
;; | Northern Ireland |    60204.0 |     |    |
;; | Northern Ireland |    73338.0 |     |    |
;; | Northern Ireland |    63054.0 |     |    |
;; ...
This bit of exploration should be enough to convince us that the reason for these fields being blank is that candidates were not put forward in the corresponding constituencies. Should they be filtered out or assumed to be zero? This is an interesting question. Let's filter them out, since it wasn't even possible for voters to choose a Liberal Democrat or Conservative candidate in these constituencies. If instead we assumed a zero, we would artificially lower the mean number of people who—given the choice—voted for either of these parties.
Now that we know how to filter the problematic rows, let's add the derived columns for the victor and the victor's share of the vote, along with election turnout. We filter the rows to show only those where both a Conservative and Liberal Democrat candidate were put forward:
(defmethod load-data :uk-victors [_]
  (->> (load-data :uk-scrubbed)
       (i/$where {:Con {:$fn number?} :LD {:$fn number?}})
       (i/add-derived-column :victors [:Con :LD] +)
       (i/add-derived-column :victors-share [:victors :Votes] /)
       (i/add-derived-column :turnout [:Votes :Electorate] /)))
As a result, we now have three additional columns in our dataset: :victors, :victors-share, and :turnout. Let's plot the victor's share of the vote as a Q-Q plot to see how it compares against the theoretical normal distribution:
(defn ex-1-28 []
  (->> (load-data :uk-victors)
       (i/$ :victors-share)
       (c/qq-plot)
       (i/view)))
The preceding code generates the following plot:
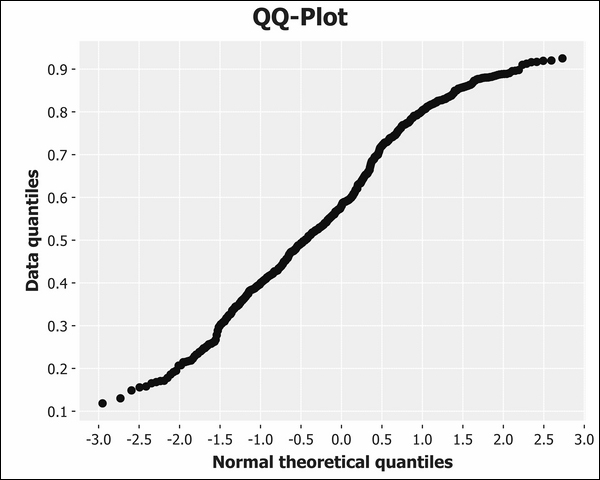
Referring back to the diagram of various Q-Q plot shapes earlier in the chapter reveals that the victor's share of the vote has "light tails" compared to the normal distribution. This means that more of the data is closer to the mean than we might expect from truly normally distributed data.