Book Image

QlikView Essentials

By : Chandraish Sinha
Book Image

QlikView Essentials

By: Chandraish Sinha

Overview of this book

This guide demonstrates just how easy it is to get started with QlikView and create your own BI application. Featuring an introduction to its core features before exploring how to load data and model it, you’ll soon become more confident that you can take full advantage of QlikView’s capabilities.. You will also learn how to use QVD files with QlikView – and how they offer a simpler way of handling data. After digging deeper into data handling, as you learn how to use mapping tables and create a master calendar, you’ll then find out how to get the most from QlikView’s visualization features – vital if you are to use your data insights effectively. From accessible and user friendly dashboards to strategies and best practices for subjecting data to further analysis, you can be confident that you’ll be prepared to get the most out of your data with QlikView. With details on how to finally secure your application and deploy it for a successful integration in your organization, QlikView Essentials underlines exactly why QlikView is becoming more and more popular for businesses that understand the value of data.
Table of Contents (15 chapters)
QlikView Essentials
Credits
About the Author
About the Reviewer
www.PacktPub.com
Preface
Index

Getting started


Let's start by understanding different concepts in building a dashboard application using QlikView.

Associative experience

In QlikView, data is always associated. As we learned in previous chapters, two tables can be associated based on common field names. All the data is present, all the time. Users can click on any list box; the selected data element in the list box turns green, the associated data elements in the other list boxes appear in white, and the data not associated appears in gray.

This can be best depicted in the following screenshot. This is taken from the QlikView Movies Database.qvw file located in the QlikView installation folder under \Program Files\QlikView\Examples\Documents.

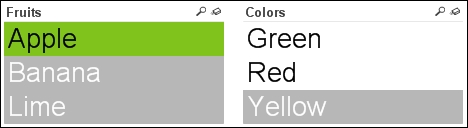
Green shows the selection made in a list box. Associated data elements appear in white and data elements not associated appear in gray. In this example, the user clicks on Apple, so Apple appears in green. Apple can be green or red, so these appear in white. Apple cannot be yellow, and...