Book Image

Python Data Analysis Cookbook

By : Ivan Idris
Book Image

Python Data Analysis Cookbook

By: Ivan Idris

Overview of this book

Data analysis is a rapidly evolving field and Python is a multi-paradigm programming language suitable for object-oriented application development and functional design patterns. As Python offers a range of tools and libraries for all purposes, it has slowly evolved as the primary language for data science, including topics on: data analysis, visualization, and machine learning. Python Data Analysis Cookbook focuses on reproducibility and creating production-ready systems. You will start with recipes that set the foundation for data analysis with libraries such as matplotlib, NumPy, and pandas. You will learn to create visualizations by choosing color maps and palettes then dive into statistical data analysis using distribution algorithms and correlations. You’ll then help you find your way around different data and numerical problems, get to grips with Spark and HDFS, and then set up migration scripts for web mining. In this book, you will dive deeper into recipes on spectral analysis, smoothing, and bootstrapping methods. Moving on, you will learn to rank stocks and check market efficiency, then work with metrics and clusters. You will achieve parallelism to improve system performance by using multiple threads and speeding up your code. By the end of the book, you will be capable of handling various data analysis techniques in Python and devising solutions for problem scenarios.
Table of Contents (23 chapters)
Python Data Analysis Cookbook
Credits
About the Author
About the Reviewers
www.PacktPub.com
Preface
Glossary
Index

Creating tables for a stock prices database


Storing stock prices only is in general not very useful. We usually want to store additional static information about companies and related derivatives such as stock options and futures. Economic theory tells us that looking for cycles and trends in historical price data is more or less a waste of time; therefore, creating a database seems be even more pointless. Of course you don't have to believe the theory, and anyway creating a stock prices database is a fun technical challenge. Also a database is useful for portfolio optimization (see the recipe, Optimizing an equal weights 2 asset portfolio).

We will base the design on the star schema pattern covered in Implementing a star schema with fact and dimension tables. The fact table will hold the prices, with a date dimension table, asset dimension table, and a source dimension table as in the following diagram:

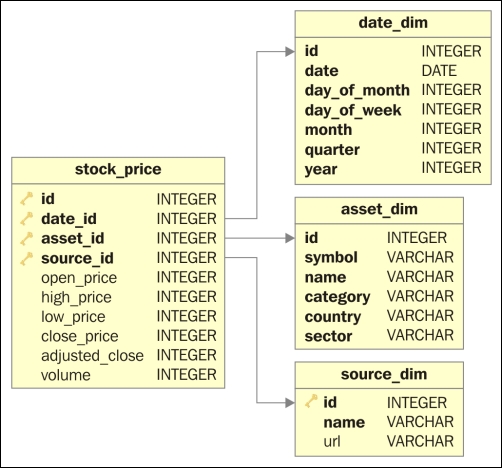
Obviously, the schema will evolve over time with tables, indexes, and columns added or...