Book Image

Julia for Data Science

By : Anshul Joshi
2 (1)
Book Image

Julia for Data Science

2 (1)
By: Anshul Joshi

Overview of this book

Julia is a fast and high performing language that's perfectly suited to data science with a mature package ecosystem and is now feature complete. It is a good tool for a data science practitioner. There was a famous post at Harvard Business Review that Data Scientist is the sexiest job of the 21st century. (https://hbr.org/2012/10/data-scientist-the-sexiest-job-of-the-21st-century). This book will help you get familiarised with Julia's rich ecosystem, which is continuously evolving, allowing you to stay on top of your game. This book contains the essentials of data science and gives a high-level overview of advanced statistics and techniques. You will dive in and will work on generating insights by performing inferential statistics, and will reveal hidden patterns and trends using data mining. This has the practical coverage of statistics and machine learning. You will develop knowledge to build statistical models and machine learning systems in Julia with attractive visualizations. You will then delve into the world of Deep learning in Julia and will understand the framework, Mocha.jl with which you can create artificial neural networks and implement deep learning. This book addresses the challenges of real-world data science problems, including data cleaning, data preparation, inferential statistics, statistical modeling, building high-performance machine learning systems and creating effective visualizations using Julia.
Table of Contents (17 chapters)
Julia for Data Science
Credits
About the Author
About the Reviewer
www.PacktPub.com
Preface

Histograms


Data exploration after a basic understanding can also be done with the aid of visualizations. Plotting a histogram is one of the most common ways of data exploration through visualization. A histogram type is used to tabulate data over a real plane separated into regular intervals.

A histogram is created using the fit method:

julia> fit(Histogram, data[, weight][, edges])  

fit takes the following arguments:

  • data: Data is passed to the fit function in the form of a vector, which can either be one-dimensional or n-dimensional (tuple of vectors of equal length).

  • weight: This is the optional argument. A WeightVec type can be passed as an argument if values have different weights. The default weight of values is 1.

  • edges: This is a vector used to give the edges of the bins along each dimension.

It also takes a keyword argument, nbins, which is used to define the number of bins that the histogram should use along each side:

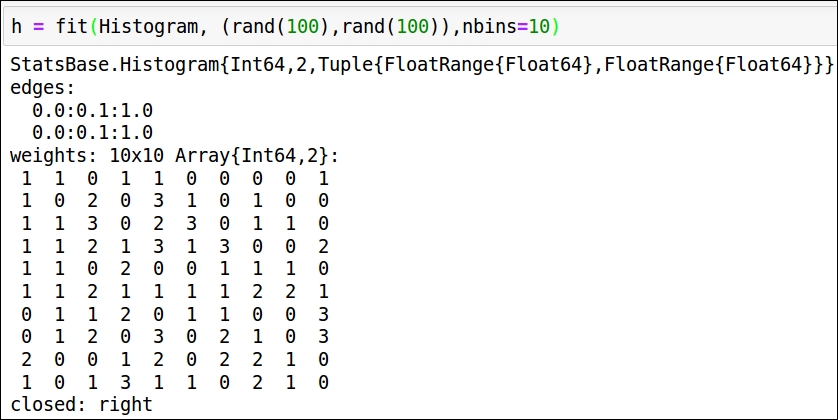
In this example, we used two random value generators...