Book Image

Jupyter for Data Science

By : Dan Toomey
Book Image

Jupyter for Data Science

By: Dan Toomey

Overview of this book

Jupyter Notebook is a web-based environment that enables interactive computing in notebook documents. It allows you to create documents that contain live code, equations, and visualizations. This book is a comprehensive guide to getting started with data science using the popular Jupyter notebook. If you are familiar with Jupyter notebook and want to learn how to use its capabilities to perform various data science tasks, this is the book for you! From data exploration to visualization, this book will take you through every step of the way in implementing an effective data science pipeline using Jupyter. You will also see how you can utilize Jupyter's features to share your documents and codes with your colleagues. The book also explains how Python 3, R, and Julia can be integrated with Jupyter for various data science tasks. By the end of this book, you will comfortably leverage the power of Jupyter to perform various tasks in data science successfully.
Table of Contents (17 chapters)
Title Page
Credits
About the Author
About the Reviewers
www.PacktPub.com
Customer Feedback
Preface

Sampling a dataset


The dplyr package has a function to gather a sample from your dataset, sample(). You pass in the dataset to operate against and how many samples you want drawn, sample_n(), and the fraction percentage, sample_frac(), as in this example:

data <- sample_n(players, 30)glimpse(data)

We see the results as shown in the following screenshot:

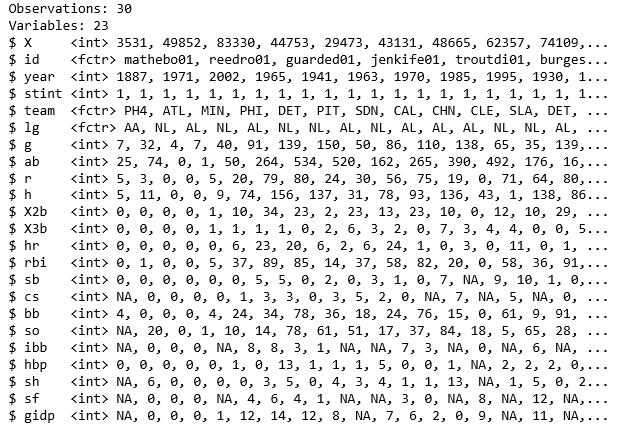
Note that there are 30 observations in the results set, as requested.

Filtering rows in a data frame

Another function we can use is the filter function. The filter function takes a data frame as an argument and a filtering statement. The function passes over each row of the data frame and returns those rows that meet the filtering statement:

#filter only players with over 200 hits in a season
over200 <- filter(players, h > 200)
head(over200)
nrow(over200)

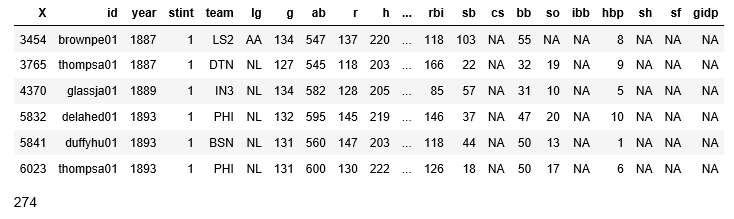
it looks like many players were capable of 200 hits a season. How about if we look at those players that could also get over 40 home runs in a season?

over200and40hr <- filter(players...