Book Image

Jupyter for Data Science

By : Dan Toomey
Book Image

Jupyter for Data Science

By: Dan Toomey

Overview of this book

Jupyter Notebook is a web-based environment that enables interactive computing in notebook documents. It allows you to create documents that contain live code, equations, and visualizations. This book is a comprehensive guide to getting started with data science using the popular Jupyter notebook. If you are familiar with Jupyter notebook and want to learn how to use its capabilities to perform various data science tasks, this is the book for you! From data exploration to visualization, this book will take you through every step of the way in implementing an effective data science pipeline using Jupyter. You will also see how you can utilize Jupyter's features to share your documents and codes with your colleagues. The book also explains how Python 3, R, and Julia can be integrated with Jupyter for various data science tasks. By the end of this book, you will comfortably leverage the power of Jupyter to perform various tasks in data science successfully.
Table of Contents (17 chapters)
Title Page
Credits
About the Author
About the Reviewers
www.PacktPub.com
Customer Feedback
Preface

Tidying up data with tidyr


The tidyr package is available to clean up/tidy your dataset. The use of tidyr is to rearrange your data so that:

  • Each column is a variable
  • Each row is an observation

When your data is arranged in this manner, it becomes much easier to analyze. There are many datasets published that mix columns and rows with values. You then must adjust them accordingly if you use the data in situ.

tidyr provides three functions for cleaning up your data:

  • gather
  • separate
  • spread

The gather() function takes your data and arranges the data into key-value pairs, much like the Hadoop database model. Let's use the standard example of stock prices for a date using the following:

library(tidyr)
stocks <- data_frame(
  time = as.Date('2017-08-05') + 0:9,
  X = rnorm(10, 20, 1), #how many numbers, mean, std dev
  Y = rnorm(10, 20, 2),
  Z = rnorm(10, 20, 4)
)

This will generate data that looks like this:

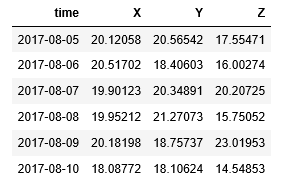
Every row has a timestamp and the prices of the three stocks at that time.

We first use gather...