Book Image

Jupyter for Data Science

By : Dan Toomey
Book Image

Jupyter for Data Science

By: Dan Toomey

Overview of this book

Jupyter Notebook is a web-based environment that enables interactive computing in notebook documents. It allows you to create documents that contain live code, equations, and visualizations. This book is a comprehensive guide to getting started with data science using the popular Jupyter notebook. If you are familiar with Jupyter notebook and want to learn how to use its capabilities to perform various data science tasks, this is the book for you! From data exploration to visualization, this book will take you through every step of the way in implementing an effective data science pipeline using Jupyter. You will also see how you can utilize Jupyter's features to share your documents and codes with your colleagues. The book also explains how Python 3, R, and Julia can be integrated with Jupyter for various data science tasks. By the end of this book, you will comfortably leverage the power of Jupyter to perform various tasks in data science successfully.
Table of Contents (17 chapters)
Title Page
Credits
About the Author
About the Reviewers
www.PacktPub.com
Customer Feedback
Preface

Visualizing glyph ready data


A glyph is a symbol. In this section, we are looking to display glyphs at different points in a graph rather than the standard dot as the glyph should provide more visual information to the viewer. Often there is an attribute about a data point that can be used to turn the data point into a useful glyph, as we will see in the following examples.

The ggplot2 package is useful for visualizing data in a variety of ways. ggplot is described as a plotting system for R. We will look at an example that displays volcano data points across the globe. I used the information from the National Center for Environmental Information at https://www.ngdc.noaa.gov/nndc. I selected volcano information post-1964.

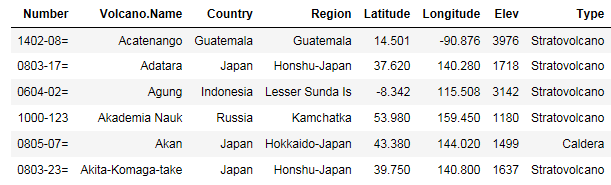
This generated a set of data that I copied into a local CSV file:

#read in the CSV file as available as described previouslyvolcanoes = read.csv("volcanoes.csv")head(volcanoes)

If we just plot out the points on a world map we can see where the volcanoes are located. We are...