

A Data Graphics is a collection of graphic items with specific configurations. The graphic items are each one of four types, Text Callout, Icon Set, Data Bar, or Color By Value. There can be multiple instances of the first three types simultaneously, but there can be only one active Color By Value.
Note
Take a look at the following article to get a stencil for each type: http://blog.bvisual.net/2015/12/24/using-visio-professional-2016-text-callouts-icon-sets-and-data-bars-to-display-data-directly/
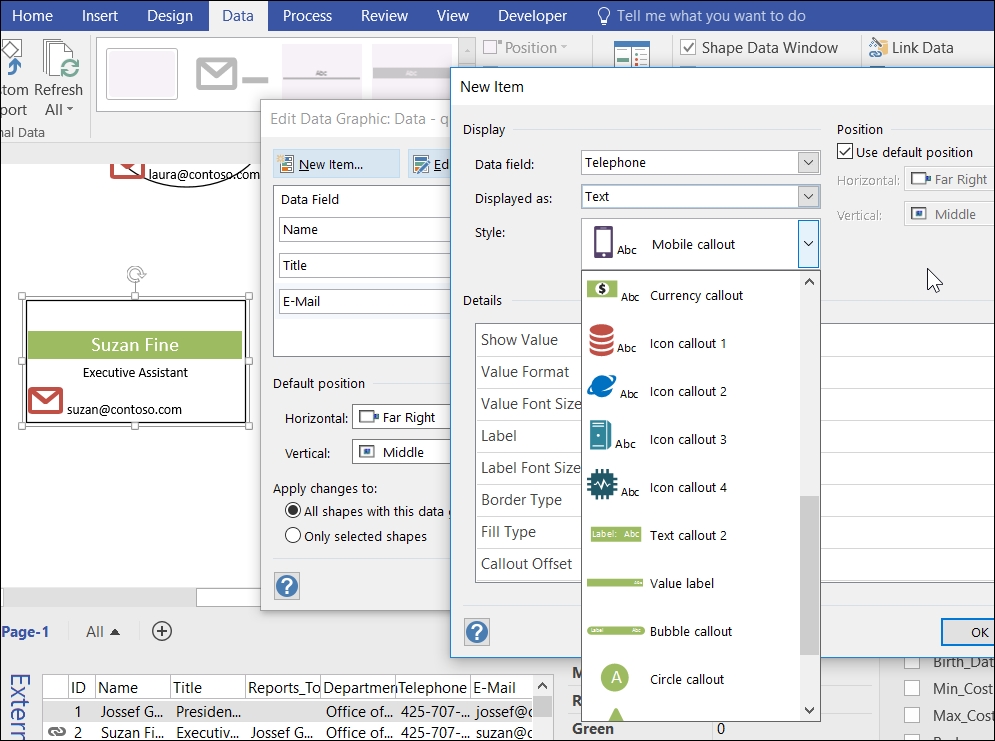
Visio 2016 introduced some new Text Callouts that include an icon along with the text. This has caused a new setting to be added called Show Value, which gives the option to make the text value invisible. There are a number of these new styles available, as seen in the following screenshot:
There are a number of configuration settings available for Text Callouts; they are listed in the following table:
|
Setting |
Comment |
|---|---|
|
Show Value |
Select from... |